FX_Fisher_Yurik
Download script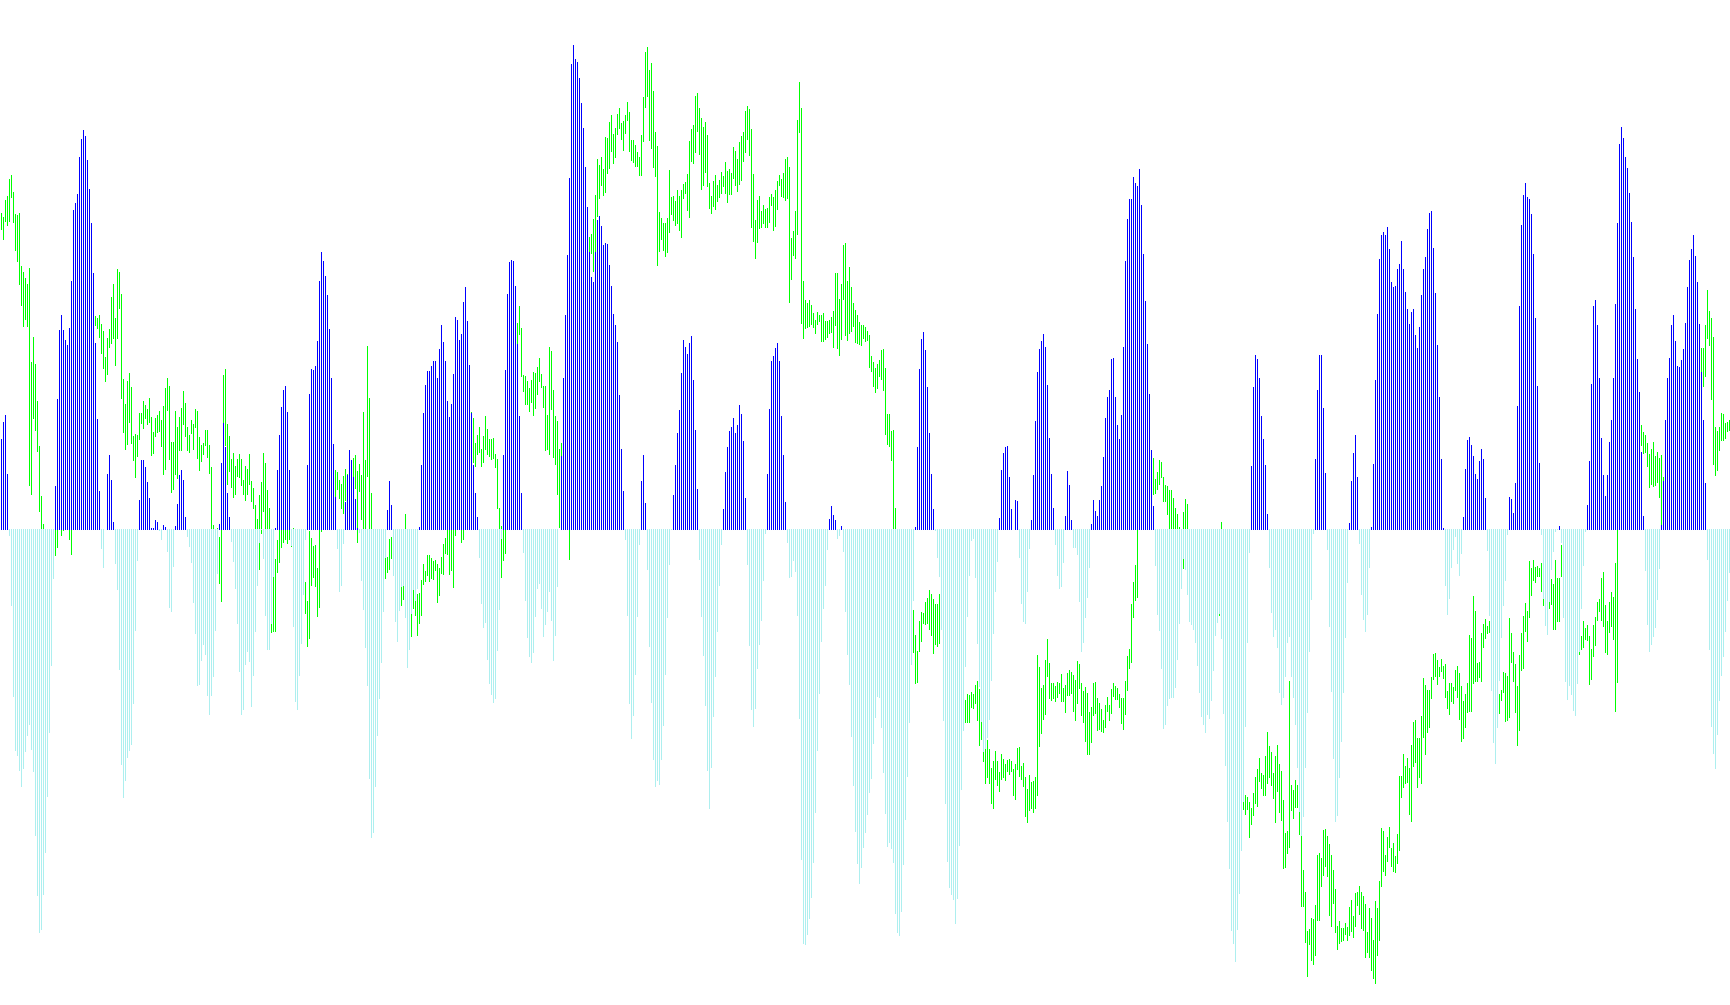
This indicator is designed to help traders visualize market momentum and identify potential trend reversals by analyzing price fluctuations over a specific timeframe. Rather than simply showing where the price is, it focuses on the "velocity" and direction of the price movement.
Core Logic Overview
The script operates by processing price data through a series of mathematical steps to smooth out market noise and highlight significant shifts in momentum:
1. Range Analysis For every candle on the chart, the tool identifies the highest high and the lowest low over a user-defined period (the "lookback" window). By comparing the current price to these extremes, the script determines where the market is currently positioned within its recent range.
2. Momentum Calculation The tool then translates this position into a momentum value. It calculates how far the price has moved relative to its recent highs and lows, applying a weighting system that considers both the current movement and the previous movement. This ensures that the resulting data is smooth and doesn't react erratically to minor, insignificant price "wiggles."
3. Logarithmic Smoothing To make the data more readable for human analysis, the script converts these momentum values into a logarithmic scale. This helps emphasize the strength of a move while keeping the indicator contained within a stable visual range.
Visual Representation and Signaling
The primary goal of this logic is to provide a clear distinction between "buying pressure" and "selling pressure." The script accomplishes this through a dual-histogram display:
- Trend Identification: The tool tracks whether the momentum is moving upward or downward. When the momentum crosses above zero, it signals bullish sentiment; when it drops below zero, it signals bearish sentiment.
- Dynamic Color Coding: Instead of showing a single continuous line, the script splits the data into two distinct visual components.
- When the market shows positive momentum (bullish), the indicator highlights that movement in one color (Steel Blue).
- When the market shows negative momentum (bearish), it highlights the movement in a different color (Orange).
Summary for the Trader
By using this logic, you can quickly see whether the current trend is gaining strength or losing steam. Because it filters out minor fluctuations, it allows you to focus on the broader direction of the market, making it easier to identify when a trend is strengthening or when the momentum has shifted significantly enough to warrant attention.
/*-----------------------------+
|			       |
| Shared by www.Aptrafx.com    |
|			       |
+------------------------------*/

#property  copyright "Copyright © 2005, Yura Prokofiev"
#property  link      "Yura.prokofiev@gmail.com"

#property  indicator_separate_window
#property  indicator_buffers 3
#property  indicator_color1  Orange
#property  indicator_color2  SteelBlue
#property  indicator_color3  Orange
extern int period=10;

double         ExtBuffer0[];
double         ExtBuffer1[];
double         ExtBuffer2[];


int init()
  {


   SetIndexStyle(0,DRAW_NONE);
   SetIndexStyle(1,DRAW_HISTOGRAM);
   SetIndexStyle(2,DRAW_HISTOGRAM);
   IndicatorDigits(Digits+1);

   SetIndexBuffer(0,ExtBuffer0);
   SetIndexBuffer(1,ExtBuffer1);
   SetIndexBuffer(2,ExtBuffer2);

   IndicatorShortName("Fisher_Yur4ik");
   SetIndexLabel(1,NULL);
   SetIndexLabel(2,NULL);

   return(0);
  }


int start()
  {
   //int     period=10;
   int    limit;
   int    counted_bars=IndicatorCounted();
   double prev,current,old;
   double Value=0,Value1=0,Value2=0,Fish=0,Fish1=0,Fish2=0;
   double price;
   double MinL=0;
   double MaxH=0;


   if(counted_bars>0) counted_bars--;
   limit=Bars-counted_bars;


   for(int i=0; i<limit; i++)
    {  MaxH = High[Highest(NULL,0,MODE_HIGH,period,i)];
       MinL = Low[Lowest(NULL,0,MODE_LOW,period,i)];
      price = (High[i]+Low[i])/2;
      Value = 0.33*2*((price-MinL)/(MaxH-MinL)-0.5) + 0.67*Value1;
      Value=MathMin(MathMax(Value,-0.999),0.999);
      ExtBuffer0[i]=0.5*MathLog((1+Value)/(1-Value))+0.5*Fish1;
      Value1=Value;
      Fish1=ExtBuffer0[i];

    }


   bool up=true;
   for(i=limit-2; i>=0; i--)
     {
      current=ExtBuffer0[i];
      prev=ExtBuffer0[i+1];

      if (((current<0)&&(prev>0))||(current<0))   up= false;
      if (((current>0)&&(prev<0))||(current>0))   up= true;

      if(!up)
        {
         ExtBuffer2[i]=current;
         ExtBuffer1[i]=0.0;
        }

       else
         {
          ExtBuffer1[i]=current;
          ExtBuffer2[i]=0.0;
         }
     }

   return(0);
  }
Comments