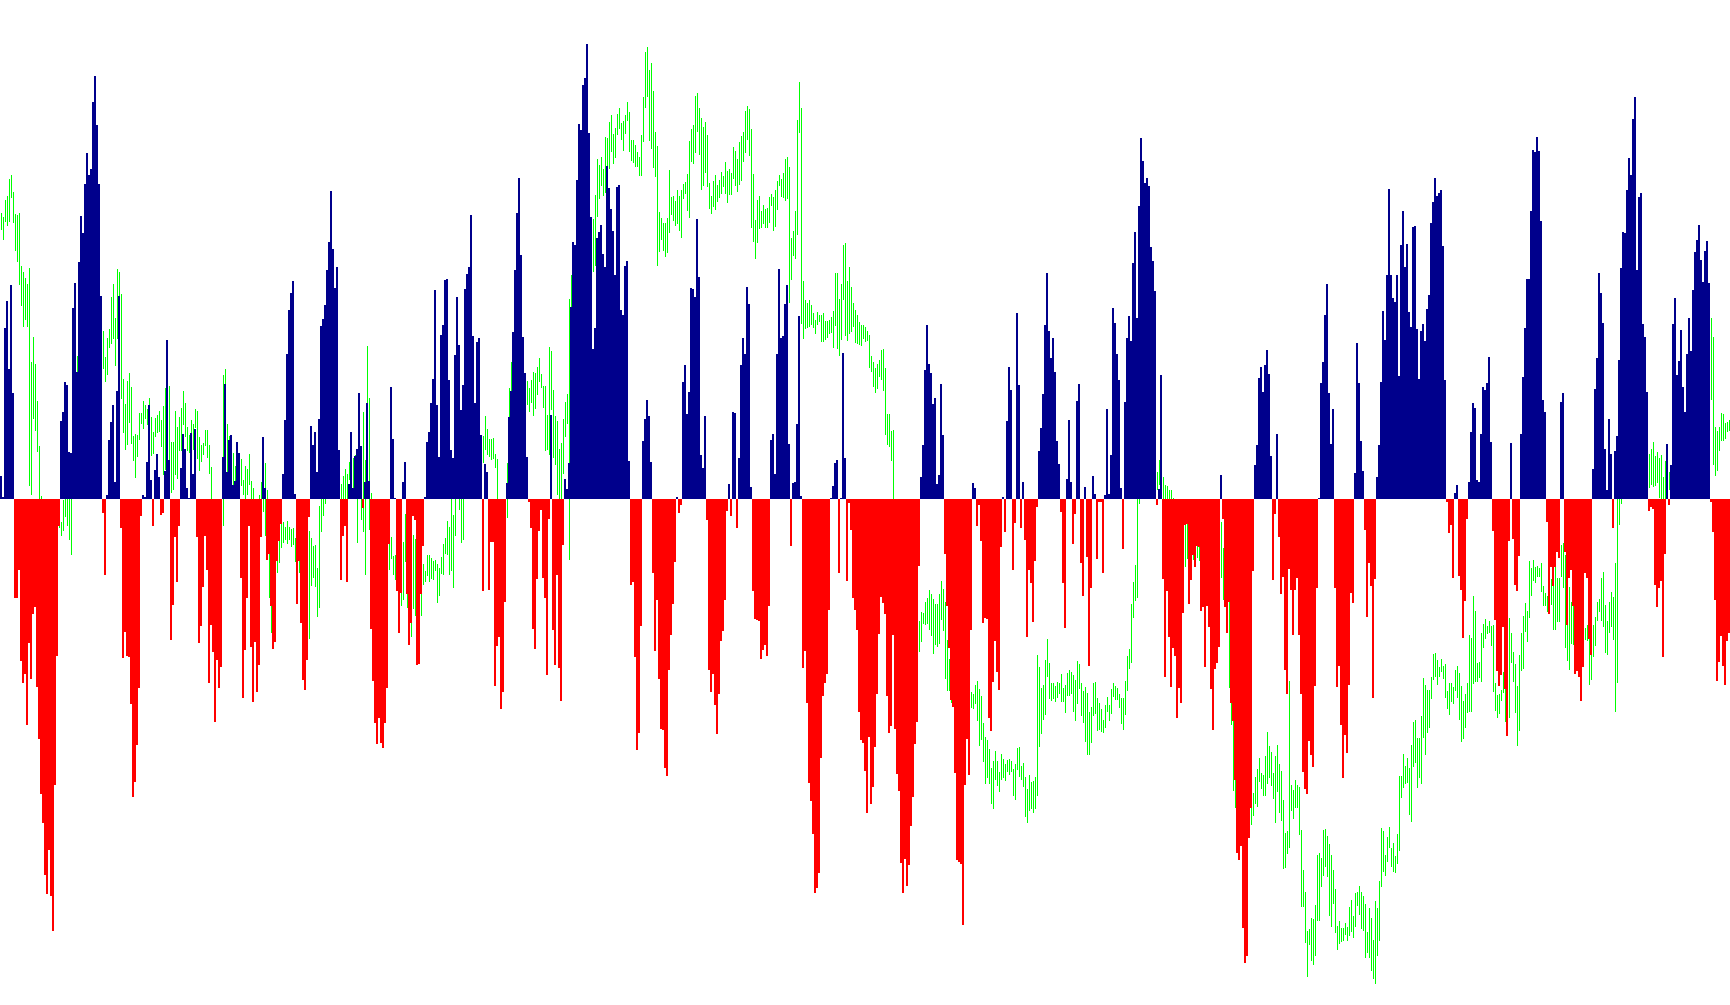
This technical tool is designed to help traders identify potential trends and momentum shifts in the financial markets by analyzing price action relative to recent highs and lows. It operates as a visual indicator that creates a dedicated window on your chart, providing clear signals for entry and exit points based on a calculated "momentum flow."
Core Logic and Methodology
Dynamic Price Positioning The script begins by looking at a specific window of historical data (the "period"). Within this window, it identifies the highest price reached and the lowest price reached. It then calculates where the current price sits between those two extremes. By understanding if the price is currently hugging the ceiling or the floor of its recent range, the indicator can gauge the strength of the prevailing move.
Smoothing and Momentum Calculation Rather than reacting wildly to every minor price flicker, the logic uses a weighting system to smooth out the data. It blends current price positions with previous data points to create a consistent flow. This "flow" is then converted into a momentum value (referred to as "Fish"). This transformation helps filter out market noise and highlights the underlying direction of the trend.
Trend Visualization The indicator displays this momentum visually using two different colored histograms:
- Positive Momentum: Shown in one color, representing upward pressure.
- Negative Momentum: Shown in another color, representing downward pressure. By watching these bars, traders can see how aggressively the market is moving in either direction.
Signal Generation
The script identifies three specific types of market events to assist the trader:
- Buy Signals: These appear when the momentum exceeds a specific "Threshold" while simultaneously showing a sharp upward curvature compared to previous points. This suggests a strong, accelerating move to the upside.
- Sell Signals: These occur when the momentum drops below a negative threshold and shows a sharp downward curvature. This indicates a powerful, accelerating shift toward the downside.
- Exit Signals: The logic also monitors for "cross-overs." If the momentum flips from positive to negative (or vice versa), it suggests that the current trend may be exhausting itself, providing a visual cue for traders to consider closing their positions at the current price.
Summary for the User
Essentially, this tool acts as a momentum speedometer. It tells you not just which way the market is moving, but how fast and with what intensity it is heading there. By identifying when that intensity reaches an extreme or begins to reverse, it aims to provide clear "Buy," "Sell," and "Exit" markers to help navigate volatile price movements.
/*-----------------------------+
|			       |
| Shared by www.Aptrafx.com    |
|			       |
+------------------------------*/

// FX_FISH
#property copyright "Copyright © 2005, Kiko Segui"
#property link      "webtecnic@terra.es"

#property indicator_separate_window
#property indicator_buffers 2
#property indicator_color1 DarkBlue
#property indicator_color2 Red
#property indicator_level1 0.2
#property indicator_level2 0.5
#property indicator_level3 1.0
#property indicator_level4 -0.2
#property indicator_level5 -0.5
#property indicator_level6 -1.0
// #property indicator_maximum 2
// #property indicator_minimum -2


double buffer1[];
double buffer2[];


extern int period=10;
extern int price=6; // 0 or other = (H+L)/2
                    // 1 = Open
                    // 2 = Close
                    // 3 = High
                    // 4 = Low
                    // 5 = (H+L+C)/3
                    // 6 = (O+C+H+L)/4
                    // 7 = (O+C)/2
extern bool Mode_Fast= True;
extern bool Signals= False;

int init()
  {
  SetIndexStyle(0,DRAW_HISTOGRAM,STYLE_SOLID,2,DarkBlue);
  SetIndexBuffer(0,buffer1);
  SetIndexStyle(1,DRAW_HISTOGRAM,STYLE_SOLID,2,Red);
  SetIndexBuffer(1,buffer2);
  return(0);
  }


int deinit()
  {
  int i;
  double tmp;


  for (i=0;i<Bars;i++)
    {
    ObjectDelete("SELL SIGNAL: "+DoubleToStr(i,0));
    ObjectDelete("BUY SIGNAL: "+DoubleToStr(i,0));
    ObjectDelete("EXIT: "+DoubleToStr(i,0));
    }
  return(0);
  }


double Value=0,Value1=0,Value2=0,Fish=0,Fish1=0,Fish2=0;

int buy=0,sell=0;

int start()
  {
  int i;
  int barras;
  double _price;
  double tmp;

  double MinL=0;
  double MaxH=0;

  double Threshold=1.2;

  barras = Bars;
  if (Mode_Fast)
    barras = 1;
  i = 1000;
  while(i>-1)
   {
   MaxH = High[Highest(NULL,0,MODE_HIGH,period,i)];
   MinL = Low[Lowest(NULL,0,MODE_LOW,period,i)];

   switch (price)
     {
     case 1: _price = Open[i]; break;
     case 2: _price = Close[i]; break;
     case 3: _price = High[i]; break;
     case 4: _price = Low[i]; break;
     case 5: _price = (High[i]+Low[i]+Close[i])/3; break;
     case 6: _price = (Open[i]+High[i]+Low[i]+Close[i])/4; break;
     case 7: _price = (Open[i]+Close[i])/2; break;
     default: _price = (High[i]+Low[i])/2; break;
     }


   Value = 0.33*2*((_price-MinL)/(MaxH-MinL)-0.5) + 0.67*Value1;
   Value=MathMin(MathMax(Value,-0.999),0.999);
   Fish = 0.5*MathLog((1+Value)/(1-Value)) -0.5*Fish1 -0.5*Fish2;

   buffer1[i]= 0;
   buffer2[i]= 0;

   if ( (Fish<0) && (Fish1>0))
     {
     if (Signals)
       {
       ObjectCreate("EXIT: "+DoubleToStr(i,0),OBJ_TEXT,0,Time[i],_price);
       ObjectSetText("EXIT: "+DoubleToStr(i,0),"EXIT AT "+DoubleToStr(_price,4),7,"Arial",White);
       }
     buy = 0;
     }
   if ((Fish>0) && (Fish1<0))
     {
     if (Signals)
       {
       ObjectCreate("EXIT: "+DoubleToStr(i,0),OBJ_TEXT,0,Time[i],_price);
       ObjectSetText("EXIT: "+DoubleToStr(i,0),"EXIT AT "+DoubleToStr(_price,4),7,"Arial",White);
       }
     sell = 0;
     }

   if (Fish>=0)
     {
     buffer1[i] = Fish;
     }
   else
     {
     buffer2[i] = Fish;
     }

   tmp = i;
   if ((Fish<-Threshold) &&
       (Fish>Fish1) &&
       (Fish1<=Fish2))
     {
     if (Signals)
       {
       ObjectCreate("SELL SIGNAL: "+DoubleToStr(i,0),OBJ_TEXT,0,Time[i],_price);
       ObjectSetText("SELL SIGNAL: "+DoubleToStr(i,0),"SELL AT "+DoubleToStr(_price,4),7,"Arial",Red);
       }
     sell = 1;
     }

  if ((Fish>Threshold) &&
       (Fish<Fish1) &&
       (Fish1>=Fish2))
    {
    if (Signals)
       {
       ObjectCreate("BUY SIGNAL: "+DoubleToStr(i,0),OBJ_TEXT,0,Time[i],_price);
       ObjectSetText("BUY SIGNAL: "+DoubleToStr(i,0),"BUY AT "+DoubleToStr(_price,4),7,"Arial",DarkBlue);
       }
    buy=1;
    }

   Value1 = Value;
   Fish2 = Fish1;
   Fish1 = Fish;

   i--;
   }
  return(0);
  }
//+------------------------------------------------------------------+
Comments