FXI_All_Pivots
Download script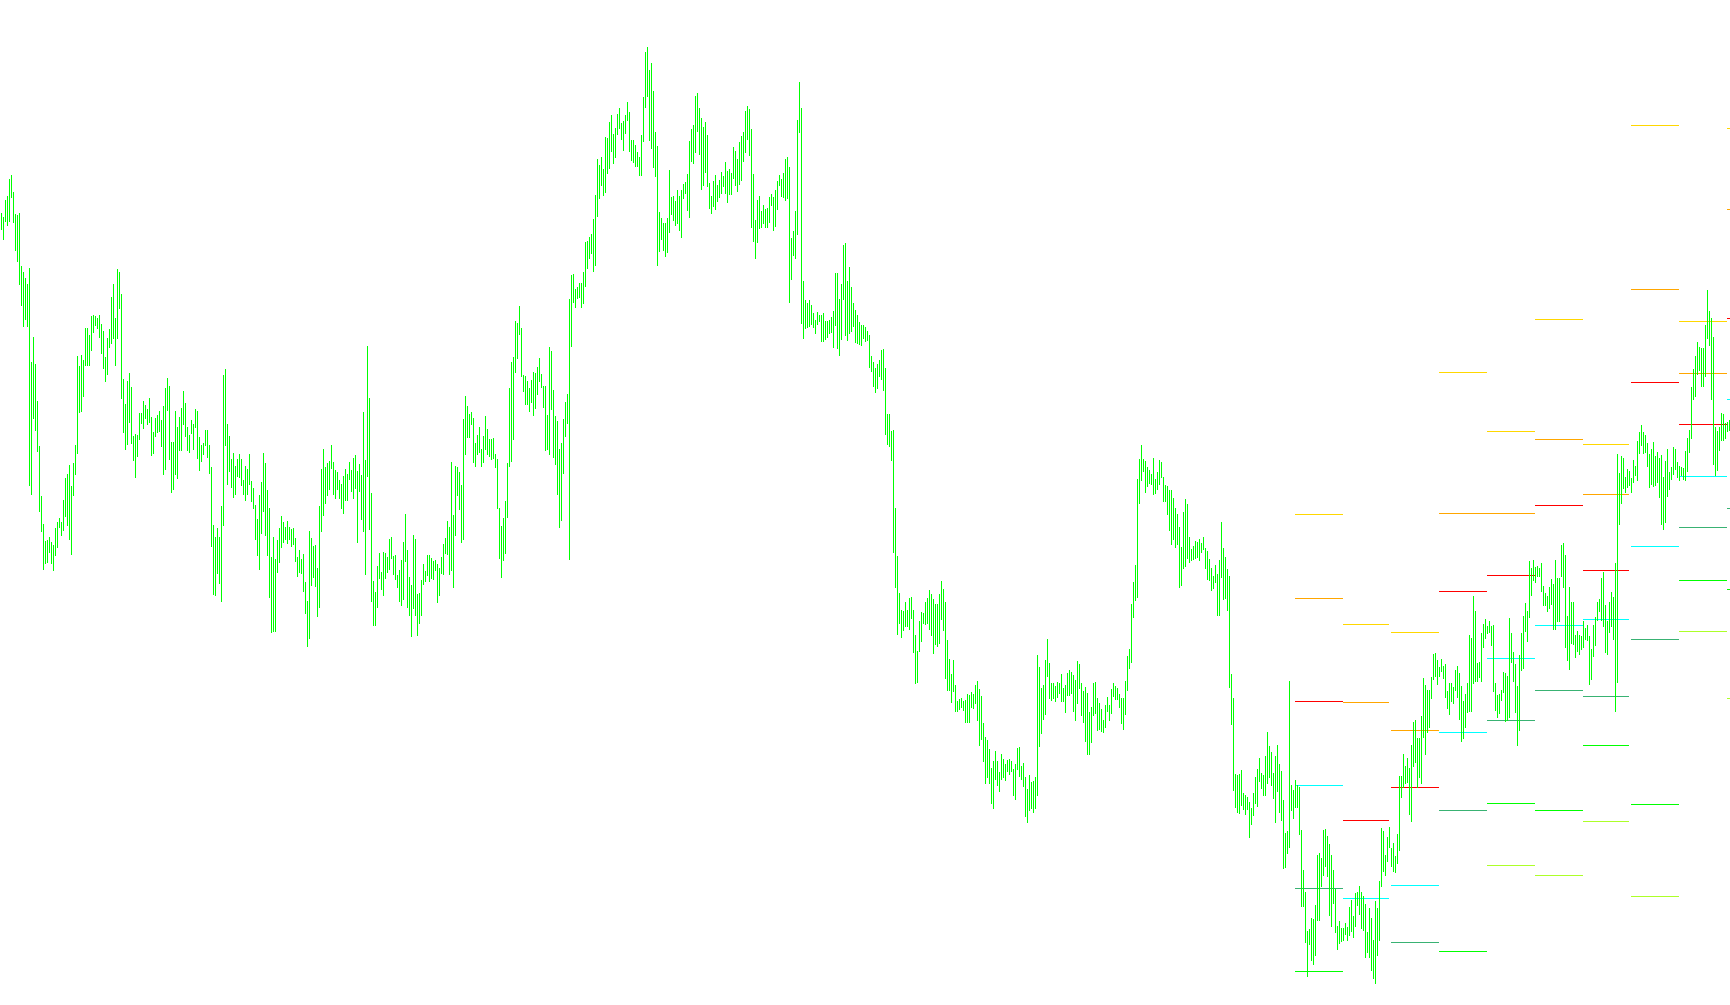
This tool is designed to automatically calculate and display various technical support and resistance levels on a trading chart based on historical price data. It helps traders visualize key "turning points" where the price might encounter difficulty moving higher or lower.
How the Logic Works
The script operates by looking at historical daily price data—specifically the High, Low, Open, and Close prices from previous days. It uses these figures to perform a series of mathematical calculations that generate three distinct types of trading levels:
1. Pivot Points (Standard) The core of the tool is the "Pivot Point" calculation. It establishes a central balance price for the day based on the average of the previous day's high, low, and closing prices. From this center point, it projects:
- Resistance Levels (R1, R2, R3): These represent price ceilings where selling pressure is expected to increase.
- Support Levels (S1, S2, S3): These represent price floors where buying interest is expected to intensify.
2. Middle Points The script can also calculate a series of intermediate "Middle" levels (M0 through M5). These act as finer gradations between the major support and resistance zones, providing extra detail for traders who need more precise entry or exit points.
3. Camarilla Levels The tool includes an optional set of "Camarilla" levels (H1-H4 and L1-L4). These are calculated using the previous day's range and current closing price. They are often used by traders to identify specific breakout boundaries or reversal zones for more active intraday trading.
Visual Organization and Customization
The script is designed to keep the chart clean and organized through several automated features:
- Historical Depth: You can choose how many days of historical data you want to see at once (e.g., the last 10 days).
- Toggleable Layers: The tool allows you to turn different categories on or off. You can choose to see just the main Pivots, add the Middle points for more detail, or include the Camarilla levels without cluttering your view with all of them at once.
- Automatic Management: Every time the chart updates, the script automatically clears out old lines and redraws the new ones based on the most recent price data. This ensures that the levels stay accurate to the current market movement without any manual intervention from the user.
//+------------------------------------------------------------------+
//|                                                 AllPivots_v1.mq4 |
//|                                                 Copyright © 2006 |
//|                                                                  |
//|                                                                  |
//+------------------------------------------------------------------+

#property indicator_chart_window

extern int  CountDays=10;
extern bool Plot_pivots=true;
extern bool Plot_middle=false;
extern bool Plot_camarilla=false;

   datetime time1;
   datetime time2;
   double open,close,high,low;
   double P,R1,R2,R3,S1,S2,S3,M0,M1,M2,M3,M4,M5;
   double H1,H2,H3,H4,L1,L2,L3,L4,Range;
   double pstyle, mstyle,cstyle;
   int shift, num;

   void ObjDel()
   {
      for (;num<=CountDays;num++)
      {
      ObjectDelete("PP["+num+"]");
      ObjectDelete("R1["+num+"]");
      ObjectDelete("R2["+num+"]");
      ObjectDelete("R3["+num+"]");
      ObjectDelete("S1["+num+"]");
      ObjectDelete("S2["+num+"]");
      ObjectDelete("S3["+num+"]");

      ObjectDelete("M0["+num+"]");
      ObjectDelete("M1["+num+"]");
      ObjectDelete("M2["+num+"]");
      ObjectDelete("M3["+num+"]");
      ObjectDelete("M4["+num+"]");
      ObjectDelete("M5["+num+"]");

      ObjectDelete("H1["+num+"]");
      ObjectDelete("H2["+num+"]");
      ObjectDelete("H3["+num+"]");
      ObjectDelete("H4["+num+"]");
      ObjectDelete("L1["+num+"]");
      ObjectDelete("L2["+num+"]");
      ObjectDelete("L3["+num+"]");
      ObjectDelete("L4["+num+"]");
      }
   }

   void PlotLine(string name,double value,double line_color,double style)
   {
   ObjectCreate(name,OBJ_TREND,0,time1,value,time2,value);
   ObjectSet(name, OBJPROP_WIDTH, 1);
   ObjectSet(name, OBJPROP_STYLE, style);
   ObjectSet(name, OBJPROP_RAY, false);
   ObjectSet(name, OBJPROP_BACK, true);
   ObjectSet(name, OBJPROP_COLOR, line_color);
    }
int init()
  {

  return(0);
  }


int deinit()
  {
   ObjDel();
   Comment("");
   return(0);
  }

int start()
  {
  int i;

  ObjDel();
  num=0;

  for (shift=CountDays-1;shift>=0;shift--)
  {
  time1=iTime(NULL,PERIOD_D1,shift);
  i=shift-1;
  if (i<0)
  time2=Time[0];
  else
  time2=iTime(NULL,PERIOD_D1,i)-Period()*60;

  high  = iHigh(NULL,PERIOD_D1,shift+1);
  low   = iLow(NULL,PERIOD_D1,shift+1);
  open  = iOpen(NULL,PERIOD_D1,shift+1);
  close = iClose(NULL,PERIOD_D1,shift+1);

  P  = (high+low+close)/3.0;

  R1 = 2*P-low;
  R2 = P+(high - low);
  R3 = (2*P)+(high-(2*low));

  S1 = 2*P-high;
  S2 = P-(high - low);
  S3 = (2*P)-((2*high)-low);

  M0=0.5*(S2+S3);
  M1=0.5*(S1+S2);
  M2=0.5*(P+S1);
  M3=0.5*(P+R1);
  M4=0.5*(R1+R2);
  M5=0.5*(R2+R3);

  Range = high - low;
  H4 = close + (Range * 1.1/2.0);
  H3 = close + (Range * 1.1/4.0);
  H2 = close + (Range * 1.1/6.0);
  H1 = close + (Range * 1.1/12.0);

  L1 = close - (Range * 1.1/12.0);
  L2 = close - (Range * 1.1/6.0);
  L3 = close - (Range * 1.1/4.0);
  L4 = close - (Range * 1.1/2.0);

  time2=time1+PERIOD_D1*60;

  pstyle=0;
  mstyle=3;
  cstyle=1;
  num=shift;

  PlotLine("PP["+num+"]",P,Aqua,pstyle);
  if(Plot_pivots)
  {

   PlotLine("R1["+num+"]",R1,Red,pstyle);
   PlotLine("R2["+num+"]",R2,Orange,pstyle);
   PlotLine("R3["+num+"]",R3,Gold,pstyle);

   PlotLine("S1["+num+"]",S1,MediumSeaGreen,pstyle);
   PlotLine("S2["+num+"]",S2,Lime,pstyle);
   PlotLine("S3["+num+"]",S3,GreenYellow,pstyle);
  }

  if(Plot_middle)
  {
   PlotLine("M0["+num+"]",M0,LightBlue,mstyle);
   PlotLine("M1["+num+"]",M1,DeepSkyBlue,mstyle);
   PlotLine("M2["+num+"]",M2,MediumSlateBlue,mstyle);
   PlotLine("M3["+num+"]",M3,Tomato,mstyle);
   PlotLine("M4["+num+"]",M4,Chocolate,mstyle);
   PlotLine("M5["+num+"]",M5,Pink,mstyle);
  }

  if(Plot_camarilla)
  {
   PlotLine("H4["+num+"]",H4,LightBlue,cstyle);
   PlotLine("H3["+num+"]",H3,DeepSkyBlue,cstyle);
   PlotLine("H2["+num+"]",H2,MediumSlateBlue,cstyle);
   PlotLine("H1["+num+"]",H1,RoyalBlue,cstyle);

   PlotLine("L1["+num+"]",L1,Chocolate,cstyle);
   PlotLine("L2["+num+"]",L2,Orange,cstyle);
   PlotLine("L3["+num+"]",L3,Goldenrod,cstyle);
   PlotLine("L4["+num+"]",L4,Yellow,cstyle);
  }
  }
   return(0);
  }
//+------------------------------------------------------------------+
Comments