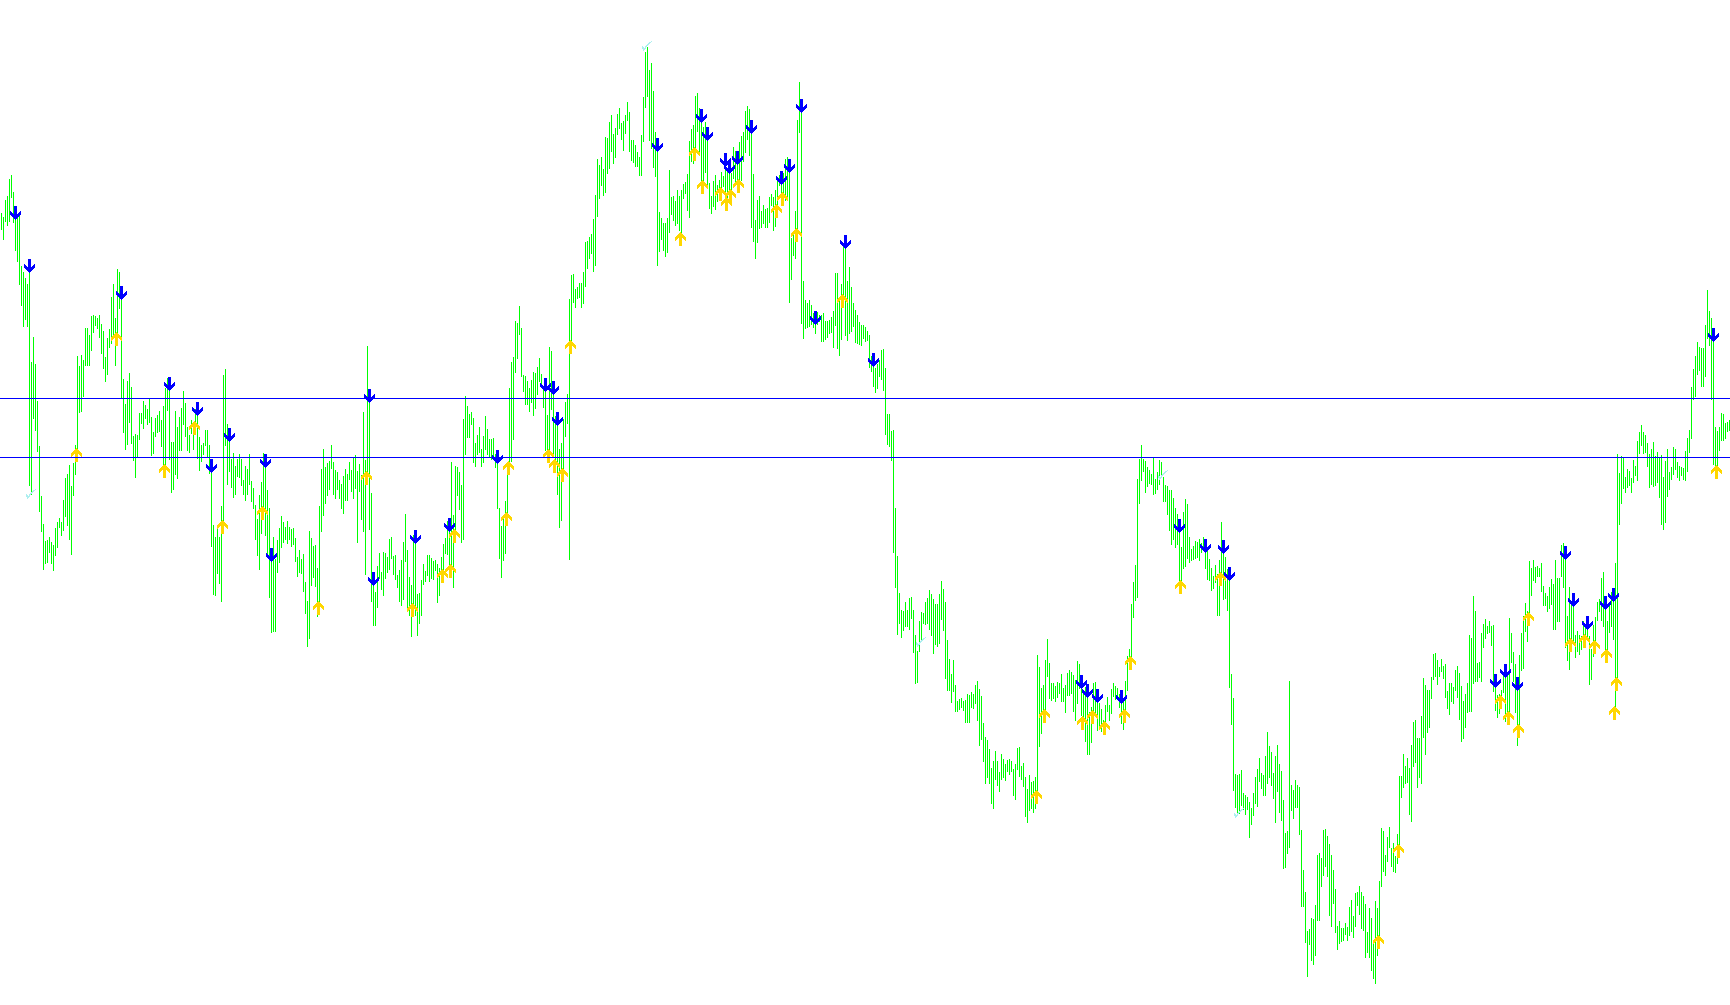
This script is a technical analysis tool designed for the MetaTrader platform to help traders identify potential entry and exit points in the financial markets. It operates by monitoring two primary momentum indicators: the Relative Strength Index (RSI) and the Average True Range (ATR).
Core Logic Overview
The tool focuses on "momentum shifts"—specifically when the RSI moves across key psychological thresholds (such as the 50, 60, 40, and 30 levels). By identifying these crossings, the script suggests where a trend might be starting, strengthening, or weakening.
How it Identifies Market Moves
1. Identifying Upward Trends (Buy Signals) The script looks for the RSI to climb above the midpoint of 50.
- Initial Entry: When the RSI crosses from below 50 to above 50, the script generates a visual "Buy" signal. At this moment, it automatically clears old data and draws two horizontal lines on your chart: one representing a Long Target (based on previous price highs and current volatility) and one representing a Stop Loss.
- Adding to Positions: If the RSI continues to climb and crosses the 60 level, the script provides an additional signal. This logic is designed to help traders "add" to an existing winning position as momentum increases.
- Profit Taking: If the RSI becomes overextended and drops back below 70, the script identifies a potential exit point for the long position.
2. Identifying Downward Trends (Sell Signals) Conversely, the script monitors for the RSI to drop below the midpoint of 50.
- Initial Entry: When the RSI crosses from above 50 to below 50, it generates a visual "Sell" signal. Similar to the buy logic, it clears previous lines and draws new horizontal lines on the chart to mark the Short Target and the Short Stop.
- Adding to Positions: If the RSI continues to drop and crosses the 40 level, the script provides another signal, allowing traders to potentially increase their short position as downward momentum grows.
- Profit Taking: If the RSI begins to bounce back up and crosses above the 30 level, the script marks a potential exit point for the short position.
Key Technical Components
- Dynamic Targets: The "Target" and "Stop" lines are not static; they are calculated using the ATR (Average True Range). This means the script adjusts your goals based on how volatile the market is at that specific time—widening during high volatility and tightening during low volatility.
- Visual Feedback: Instead of just providing numbers, the script paints arrows directly on your price chart to highlight exactly where these momentum shifts occur, making it easier to visualize the "flow" of the market.
- Clean Interface: The logic includes a "cleanup" feature that deletes old target lines whenever a new primary trend signal is detected, ensuring your chart remains uncluttered and focused on the current trade setup.
//+------------------------------------------------------------------+
//|                                       FXA0 - RSI Crossing 50.mq4 |
//|                           Copyright © 2007, Adam J. Richter M.S. |
//|                                                                  |
//+------------------------------------------------------------------+
#property copyright "Copyright © 2007, Adam J. Richter M.S."

#property indicator_chart_window
#property indicator_buffers 3
#property indicator_color1 Blue
#property indicator_color2 Red
#property indicator_color3 Green

double dUpRsiBuffer[];
double dDownRsiBuffer[];
double dSellBuffer[];

extern double ATR_Percent = 0.15;  //This value sets the ATR Used, The ATR is 15%
extern double RSI_Period = 21;  //This value sets the RSI Period Used, The default is 21
extern double ATR_Period = 21;  //This value sets the ATR Period Used, The default is 21

int RowNum = 0;
int LastTrend = -1;
int UP_IND    = 1;
int DOWN_IND  = 0;

//+------------------------------------------------------------------+
//| Custom indicator initialization function                         |
//+------------------------------------------------------------------+
int init()
  {
//---- indicator buffers mapping
    SetIndexBuffer(0,dUpRsiBuffer);
    SetIndexBuffer(1,dDownRsiBuffer);
    SetIndexBuffer(2,dSellBuffer);
//---- drawing settings
    SetIndexStyle(0,DRAW_ARROW);
    SetIndexArrow(0,233); //241 option for different arrow head
    SetIndexStyle(1,DRAW_ARROW);
    SetIndexArrow(1,234); //242 option for different arrow head
    SetIndexStyle(2,DRAW_ARROW);
    SetIndexArrow(2,252);  //251 x sign or 252 green check

//----
    SetIndexEmptyValue(0,0.0);
    SetIndexEmptyValue(1,0.0);
    SetIndexEmptyValue(2,0.0);
//---- name for DataWindow
    SetIndexLabel(0,"Rsi Buy");
    SetIndexLabel(1,"Rsi Sell");
    SetIndexLabel(2,"Exit");
//----


   return(0);
  }
//+------------------------------------------------------------------+
//| Custor indicator deinitialization function                       |
//+------------------------------------------------------------------+
int deinit()
  {
//----
//----
   return(0);
  }


void printmyline(double vala, int topbottom) //print target line
{
   if(topbottom==1)//target
   {
      ObjectCreate("thetarget " + vala,OBJ_HLINE,0,0,vala);
      ObjectSet("thetarget " + vala,OBJPROP_COLOR, Blue);
      ObjectSetText("thetarget " + vala,"Long Target",13,"Arial",Black);
   }
   if(topbottom==2)//stop
   {
      ObjectCreate("thestop " + vala,OBJ_HLINE,0,0,vala);
      ObjectSet("thestop " + vala,OBJPROP_COLOR, Blue);
      ObjectSetText("thestop " + vala,"Long Stop",13,"Arial",Black);
   }
}


void printmylinedown(double vala, int topbottom) //print target line
{
   if(topbottom==1)//target
   {
      ObjectCreate("thetarget " + vala,OBJ_HLINE,0,0,vala);
      ObjectSet("thetarget " + vala,OBJPROP_COLOR, Red);
      ObjectSetText("thetarget " + vala,"Short Target",13,"Arial",Black);
   }
   if(topbottom==2)//stop
   {
      ObjectCreate("thestop " + vala,OBJ_HLINE,0,0,vala);
      ObjectSet("thestop " + vala,OBJPROP_COLOR, Red);
      ObjectSetText("thestop " + vala,"Short Stop",13,"Arial",Black);
   }
}

void deletealllines()
{
   ObjectsDeleteAll();
}

//+------------------------------------------------------------------+
//| Custom indicator iteration function                              |
//+------------------------------------------------------------------+
int start()
  {
   int nBars,nCountedBars;

    nCountedBars=IndicatorCounted(); //ncountedbars 655
//---- check for possible errors
    if(nCountedBars<0) return(-1);
//---- last counted bar will be recounted
    if(nCountedBars<=2)
       nBars=Bars-nCountedBars-3;

    if(nCountedBars>2)
      {
       nCountedBars--;
       nBars=Bars-nCountedBars-1; //number of bars in current chart-655-1
      }
double lastRSI60arrow = NULL; //if going long
double lastRSI40arrow = NULL; //if going short
int lastCloseLong=0;
int lastCloseShort=0;

   for (int ii=Bars; ii>0; ii--)
   {

      dUpRsiBuffer[ii]=0;
      dDownRsiBuffer[ii]=0;

      double myRSInow = iRSI(NULL,0,RSI_Period,PRICE_CLOSE,ii);
      double myRSI2 = iRSI(NULL,0,RSI_Period,PRICE_CLOSE,ii+1); //RSI One bar ago
      double myATR1 = iATR(NULL,PERIOD_D1,ATR_Period,ii);


      if (myRSInow>=50) //is going long
      {
         if(myRSInow>50 && myRSI2<50) //did it cross from below 50
         {
            deletealllines();
            dUpRsiBuffer[ii] = Low[ii] - 2 * MarketInfo(Symbol(),MODE_POINT);
            printmyline((iHigh(NULL,0,ii+1)+(myATR1*ATR_Percent)),1);
            printmyline((iHigh(NULL,0,ii+1)+(myATR1*ATR_Percent))-(0.30*myATR1),2);
            lastRSI60arrow=0;
            lastCloseLong=0;
         }
         if(myRSInow>=60 && myRSI2<60) //add to position at cross of 60, sometimes this can occur twice
         {
               if(lastRSI60arrow>=60) //don't draw another arrow
               {
               }
               if(lastRSI60arrow<=60) //draw another arrow for adding to position
               {
                  dUpRsiBuffer[ii] = Low[ii] - 2 * MarketInfo(Symbol(),MODE_POINT);
                  lastRSI60arrow = myRSInow;
               }
         }

         if(myRSInow<70 && myRSI2>=70) //sell first lot
         {
            if(lastCloseLong==0)
            {
               dSellBuffer[ii] = High[ii] + 2 * MarketInfo(Symbol(),MODE_POINT);
               lastCloseLong=1;
            }
         }
      }

      if(myRSInow<50)  //is going short
      {
         if(myRSInow<50 && myRSI2>50) //did it cross from above 50
         {
            deletealllines();
            dDownRsiBuffer[ii] = High[ii] + 2 * MarketInfo(Symbol(),MODE_POINT);
            printmylinedown((iLow(NULL,0,ii+1)-(myATR1*ATR_Percent)),1);
            printmylinedown((iLow(NULL,0,ii+1)-(myATR1*ATR_Percent))+(0.30*myATR1),2);
            lastCloseShort=0;
            lastRSI40arrow=myRSInow; //set out of area
         }
         if(myRSInow<40 && myRSI2>40)
         {
            if(lastRSI40arrow<=40) //don't draw another arrow
            {

            }
            if(lastRSI40arrow>=40) //draw another arrow to add to position
            {
               dDownRsiBuffer[ii] = High[ii] + 2 * MarketInfo(Symbol(),MODE_POINT);
               lastRSI40arrow=myRSInow;
            }
         }
         if(myRSInow>30 && myRSI2<30)
         {
            if(lastCloseShort==0)
            {
               dSellBuffer[ii] = Low[ii] - 4 * MarketInfo(Symbol(),MODE_POINT);
               lastCloseShort=1;
            }
         }
      }


   }
}
Comments