FX_FISH_v2
Download script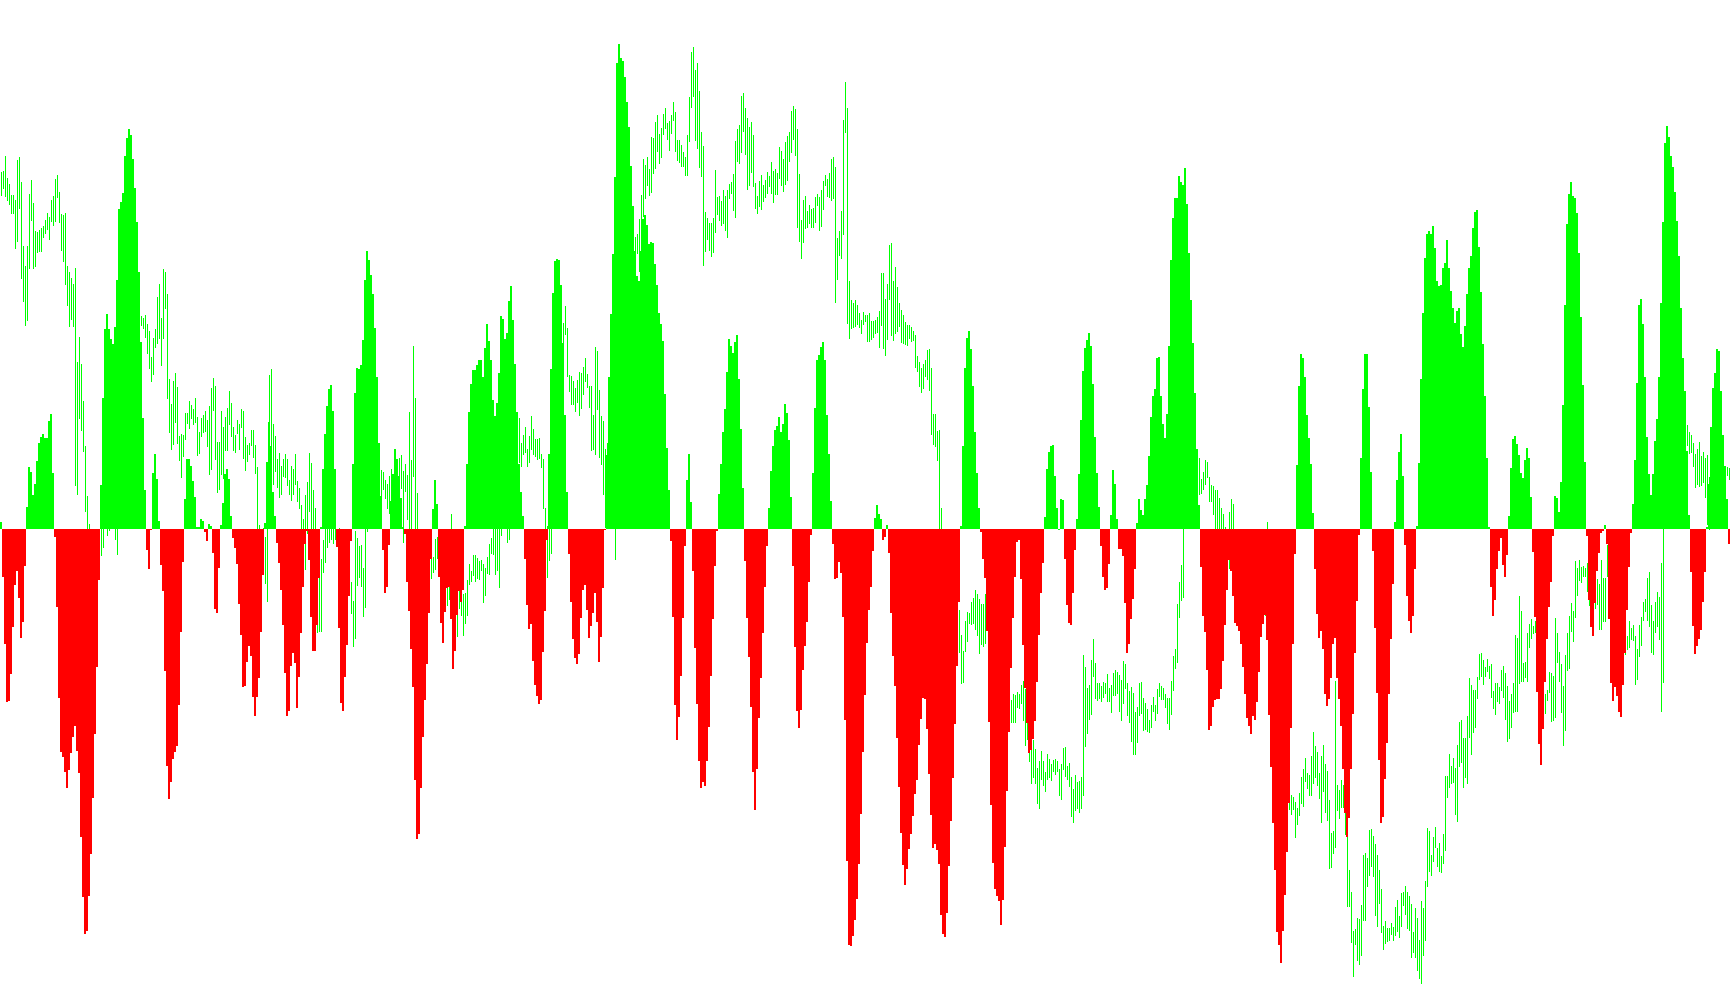
This tool is a technical analysis indicator designed to help traders identify market momentum and potential entry or exit points by visualizing price trends in a separate window. It uses a specialized mathematical model to smooth out market volatility, allowing for a clearer view of the underlying price direction.
Core Logic and Calculation
The script operates by analyzing specific price points over a user-defined period (such as the High, Low, Open, or Close of a candle). To determine the strength of the current movement, it calculates the relative position of the price between the highest high and the lowest low reached during that period.
This calculation is then processed through a multi-stage smoothing filter:
- Relative Positioning: It determines where the price sits within its recent range.
- Weighted Smoothing: It applies a weighted moving average to this data, ensuring that the indicator doesn't react erratically to minor price fluctuations while remaining responsive to meaningful trends.
- Logarithmic Conversion: The script uses a logarithmic transformation to normalize the values, which helps in identifying extremes and creating a more balanced visual representation of "bullish" versus "bearish" sentiment.
Visual Output and Signals
The results are displayed as a histogram in a separate window below the main price chart:
- Bullish Momentum (Lime): When the calculated value is positive, it appears as a Lime-colored histogram, indicating upward pressure.
- Bearish Momentum (Red): When the calculated value is negative, it appears as a Red-colored histogram, indicating downward pressure.
Trade Signal Mechanics
The script includes an optional automated signaling system that places text labels directly on the price chart:
- Entry Signals: The tool identifies high-momentum shifts. If the momentum exceeds a specific "Threshold" and shows a significant reversal from previous values, it generates a BUY SIGNAL (in Lime) or a SELL SIGNAL (in Red). This indicates that the trend has gained sufficient strength to potentially initiate a trade.
- Exit Signals: The logic also detects "crossovers"—moments where the momentum shifts from positive to negative (or vice versa). When these flips occur, the tool can display an EXIT label, suggesting that the previous trend may be losing its steam and it might be time to close a position.
Summary of User Customization
Users can tailor the sensitivity and behavior of the logic by adjusting:
- The Period, which determines how far back the script looks to find highs and lows.
- The Price Source, allowing the user to choose whether the math should be based on the candle's body, its extremes, or a mathematical average.
- The Fast Mode, which limits the look-back calculation for quicker reactions in highly volatile environments.
/*-----------------------------+
|			       |
| Shared by www.Aptrafx.com    |
|			       |
+------------------------------*/

// FX_FISH
#property copyright "Copyright © 2005, Kiko Segui"
#property link      "webtecnic@terra.es"

#property indicator_separate_window
#property indicator_buffers 2
#property indicator_color1 Lime
#property indicator_color2 Red


double buffer1[];
double buffer2[];


extern int period=10;
extern int price=0; // 0 or other = (H+L)/2
                    // 1 = Open
                    // 2 = Close
                    // 3 = High
                    // 4 = Low
                    // 5 = (H+L+C)/3
                    // 6 = (O+C+H+L)/4
                    // 7 = (O+C)/2
extern bool Mode_Fast= False;
extern bool Signals= False;

int init()
  {
  SetIndexStyle(0,DRAW_HISTOGRAM,STYLE_SOLID,2,Lime);
  SetIndexBuffer(0,buffer1);
  SetIndexStyle(1,DRAW_HISTOGRAM,STYLE_SOLID,2,Red);
  SetIndexBuffer(1,buffer2);
  return(0);
  }


int deinit()
  {
  int i;
  double tmp;


  for (i=0;i<Bars;i++)
    {
    ObjectDelete("SELL SIGNAL: "+DoubleToStr(i,0));
    ObjectDelete("BUY SIGNAL: "+DoubleToStr(i,0));
    ObjectDelete("EXIT: "+DoubleToStr(i,0));
    }
  return(0);
  }


double Value=0,Value1=0,Value2=0,Fish=0,Fish1=0,Fish2=0;

int buy=0,sell=0;

int start()
  {
  int i;
  int barras;
  double _price;
  double tmp;

  double MinL=0;
  double MaxH=0;

  double Threshold=1.2;

  barras = Bars;
  if (Mode_Fast)
    barras = 100;
  i = 0;
  while(i<barras)
   {
   MaxH = High[Highest(NULL,0,MODE_HIGH,period,i)];
   MinL = Low[Lowest(NULL,0,MODE_LOW,period,i)];

   switch (price)
     {
     case 1: _price = Open[i]; break;
     case 2: _price = Close[i]; break;
     case 3: _price = High[i]; break;
     case 4: _price = Low[i]; break;
     case 5: _price = (High[i]+Low[i]+Close[i])/3; break;
     case 6: _price = (Open[i]+High[i]+Low[i]+Close[i])/4; break;
     case 7: _price = (Open[i]+Close[i])/2; break;
     default: _price = (High[i]+Low[i])/2; break;
     }


   Value = 0.33*2*((_price-MinL)/(MaxH-MinL)-0.5) + 0.67*Value1;
   Value=MathMin(MathMax(Value,-0.999),0.999);
   Fish = 0.5*MathLog((1+Value)/(1-Value))+0.5*Fish1;

   buffer1[i]= 0;
   buffer2[i]= 0;

   if ( (Fish<0) && (Fish1>0))
     {
     if (Signals)
       {
       ObjectCreate("EXIT: "+DoubleToStr(i,0),OBJ_TEXT,0,Time[i],_price);
       ObjectSetText("EXIT: "+DoubleToStr(i,0),"EXIT AT "+DoubleToStr(_price,4),7,"Arial",White);
       }
     buy = 0;
     }
   if ((Fish>0) && (Fish1<0))
     {
     if (Signals)
       {
       ObjectCreate("EXIT: "+DoubleToStr(i,0),OBJ_TEXT,0,Time[i],_price);
       ObjectSetText("EXIT: "+DoubleToStr(i,0),"EXIT AT "+DoubleToStr(_price,4),7,"Arial",White);
       }
     sell = 0;
     }

   if (Fish>=0)
     {
     buffer1[i] = Fish;
     }
   else
     {
     buffer2[i] = Fish;
     }

   tmp = i;
   if ((Fish<-Threshold) &&
       (Fish>Fish1) &&
       (Fish1<=Fish2))
     {
     if (Signals)
       {
       ObjectCreate("SELL SIGNAL: "+DoubleToStr(i,0),OBJ_TEXT,0,Time[i],_price);
       ObjectSetText("SELL SIGNAL: "+DoubleToStr(i,0),"SELL AT "+DoubleToStr(_price,4),7,"Arial",Red);
       }
     sell = 1;
     }

  if ((Fish>Threshold) &&
       (Fish<Fish1) &&
       (Fish1>=Fish2))
    {
    if (Signals)
       {
       ObjectCreate("BUY SIGNAL: "+DoubleToStr(i,0),OBJ_TEXT,0,Time[i],_price);
       ObjectSetText("BUY SIGNAL: "+DoubleToStr(i,0),"BUY AT "+DoubleToStr(_price,4),7,"Arial",Lime);
       }
    buy=1;
    }

   Value1 = Value;
   Fish2 = Fish1;
   Fish1 = Fish;

   i++;
   }
  return(0);
  }
//+------------------------------------------------------------------+
Comments