GG-TimeBox
Indicator

GG-TimeBox

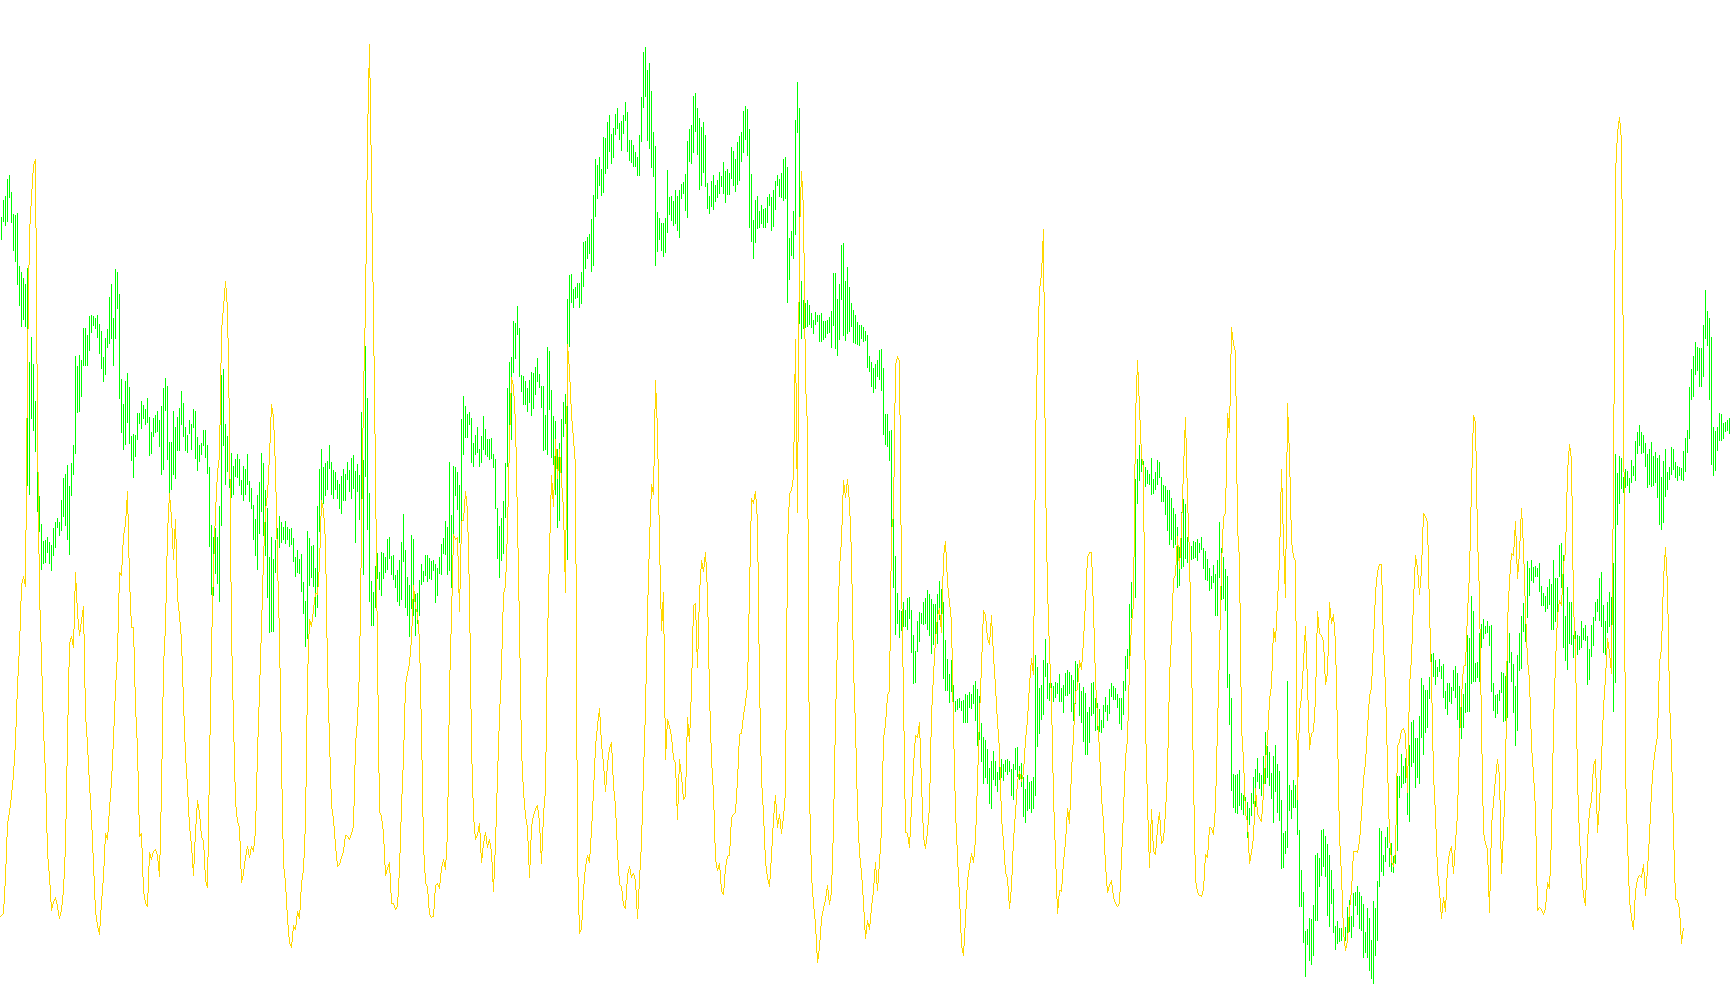
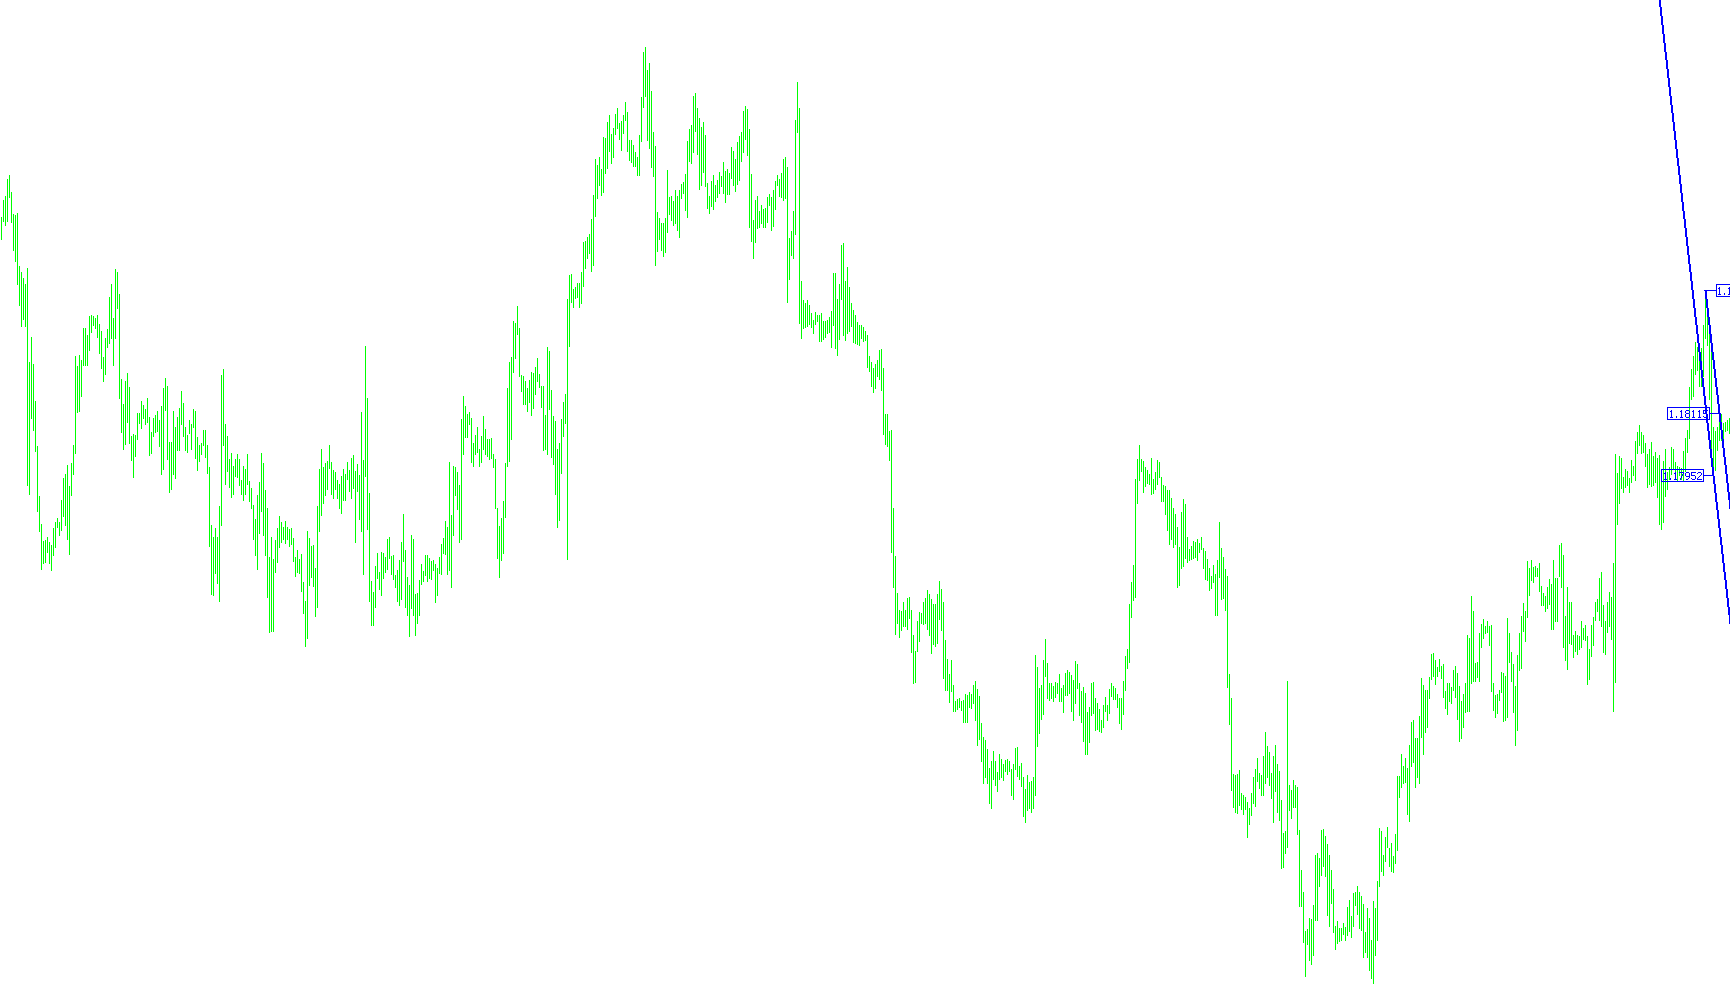
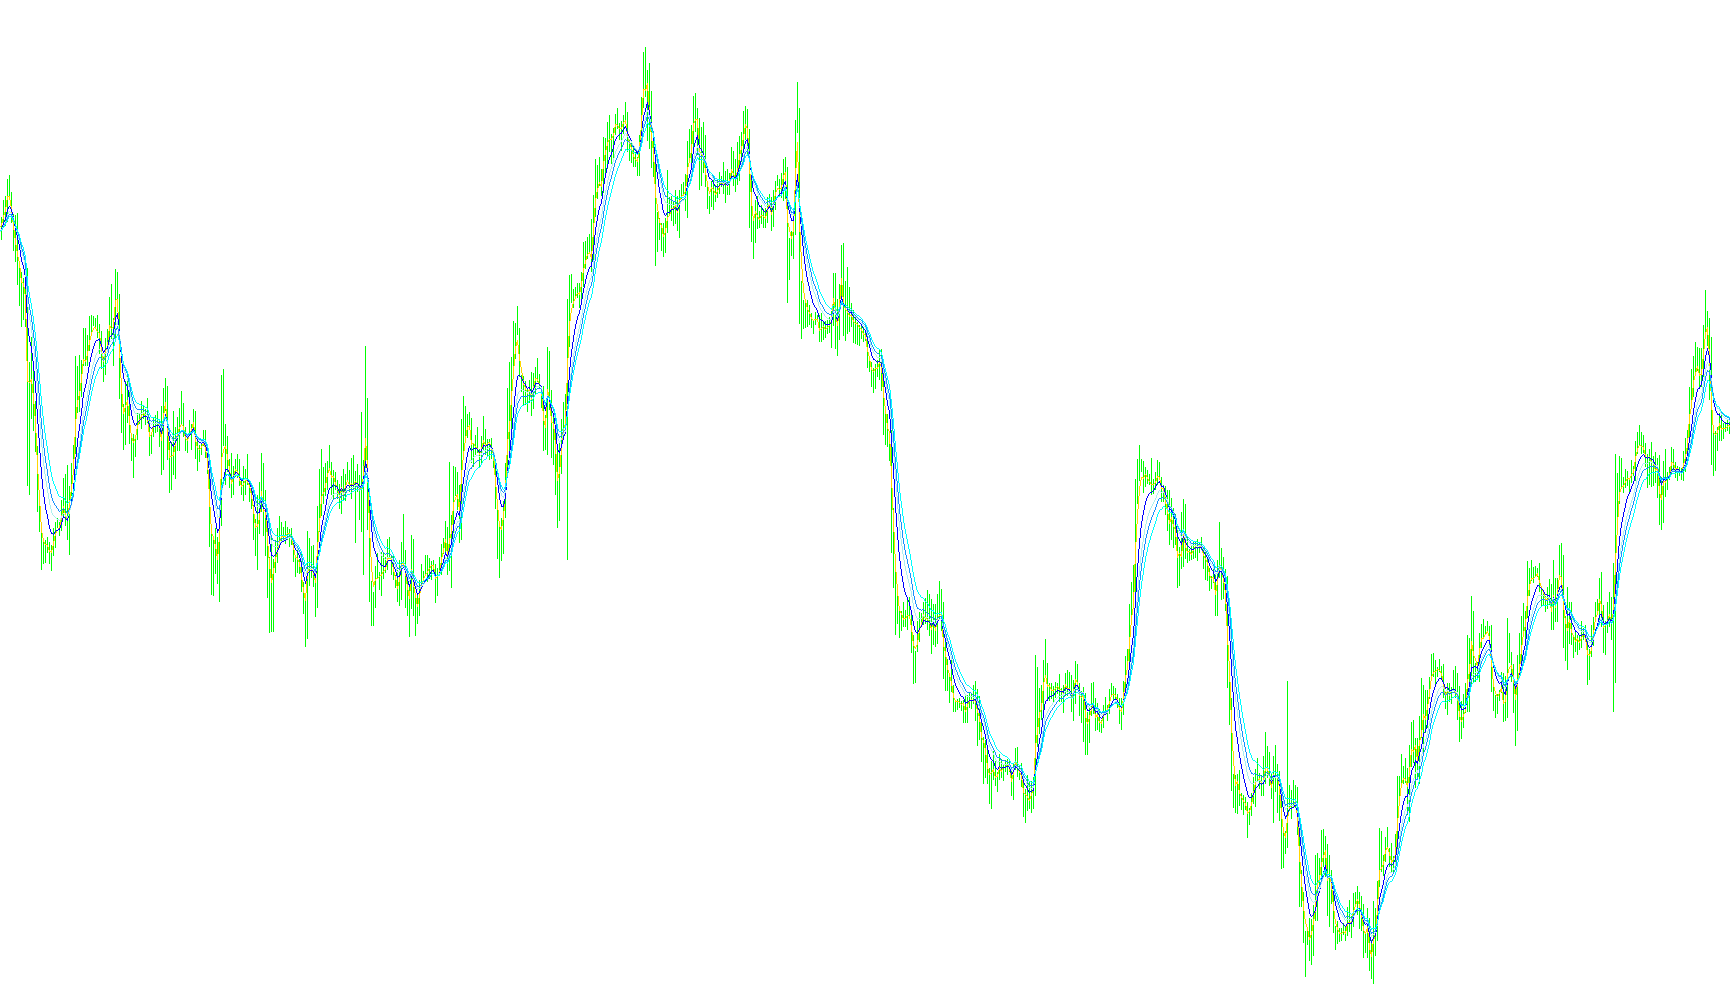
This indicator projects geometric historical price containers onto the current chart to visualize higher timeframe volatility and candle sentiment.

GG-TimeFramer
Indicator

GG-TimeFramer

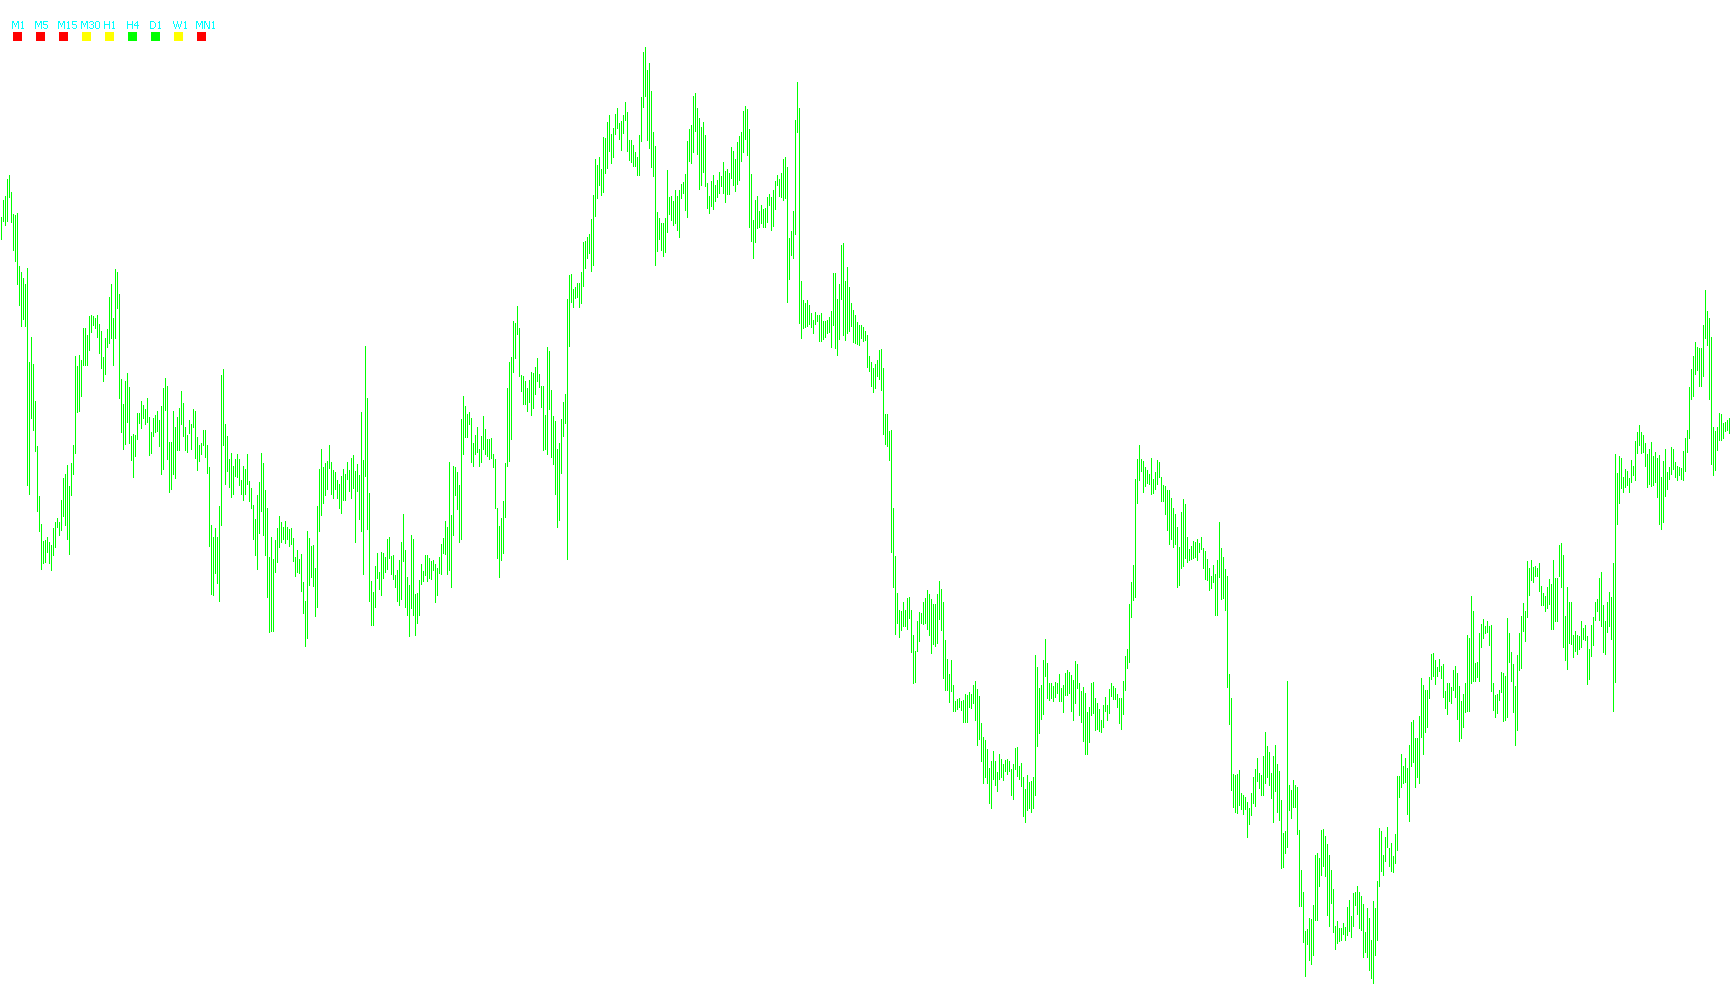
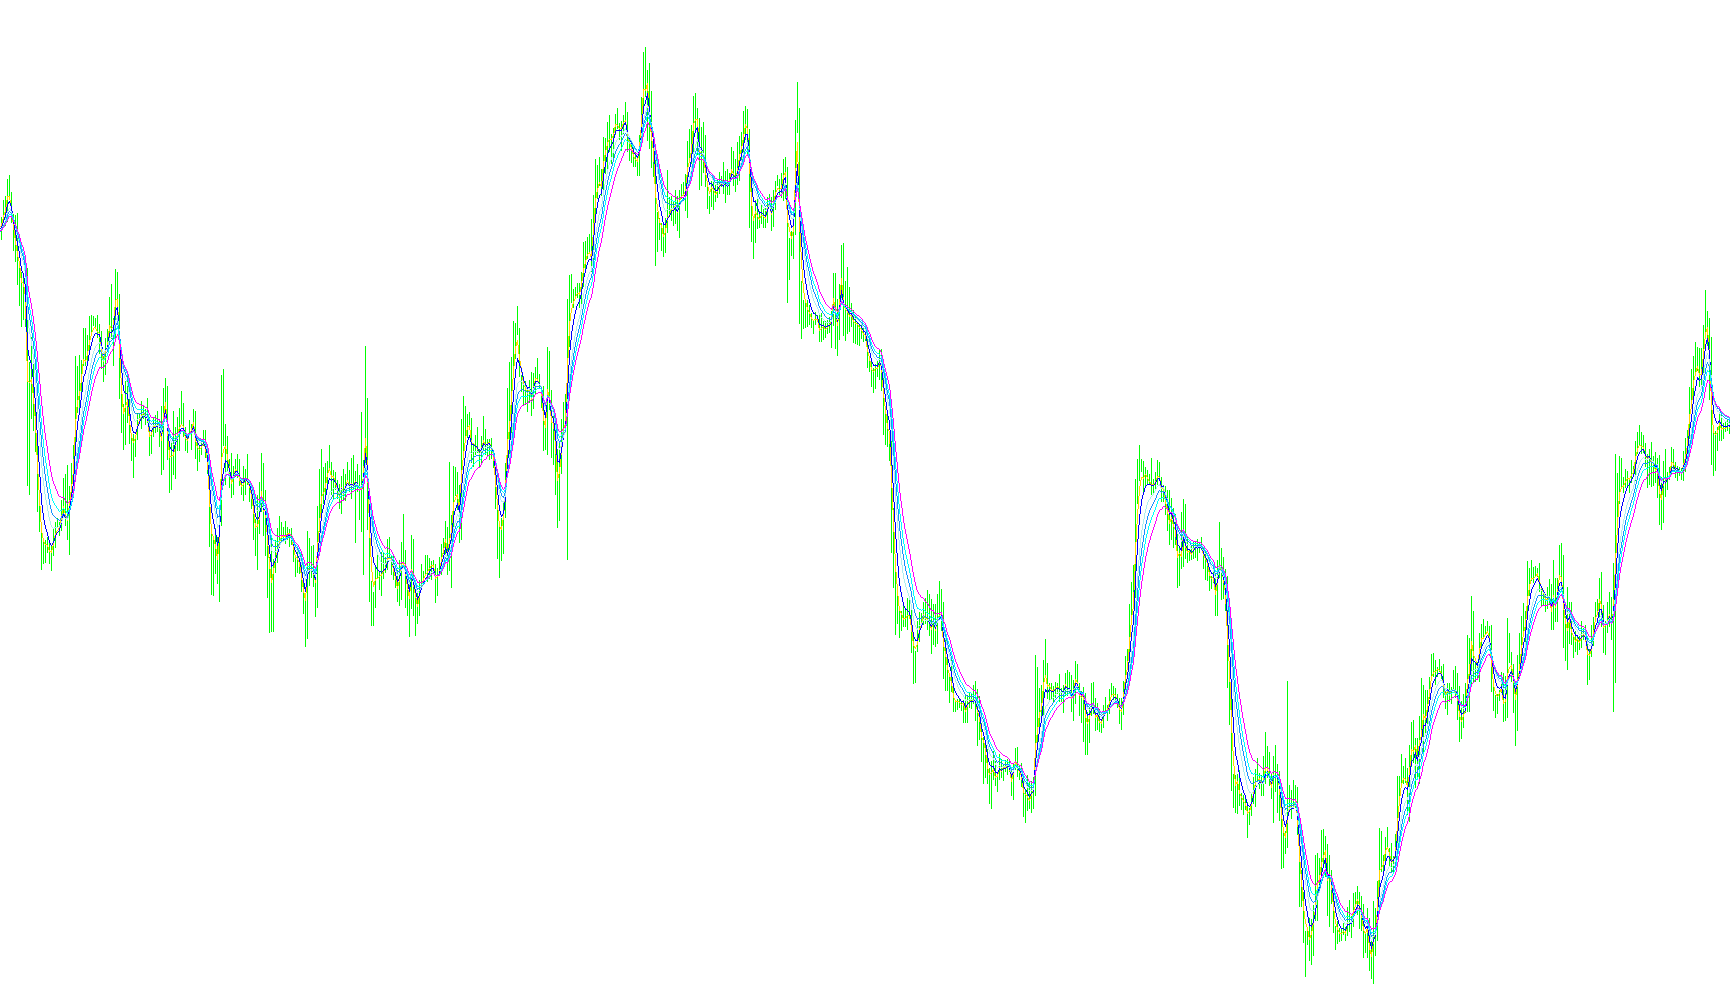
This indicator visualizes concurrent price action and high/low boundaries across multiple timeframes simultaneously to identify structural alignment.
GG-TrendBar
Indicator

GG-TrendBar

iADXiSAR

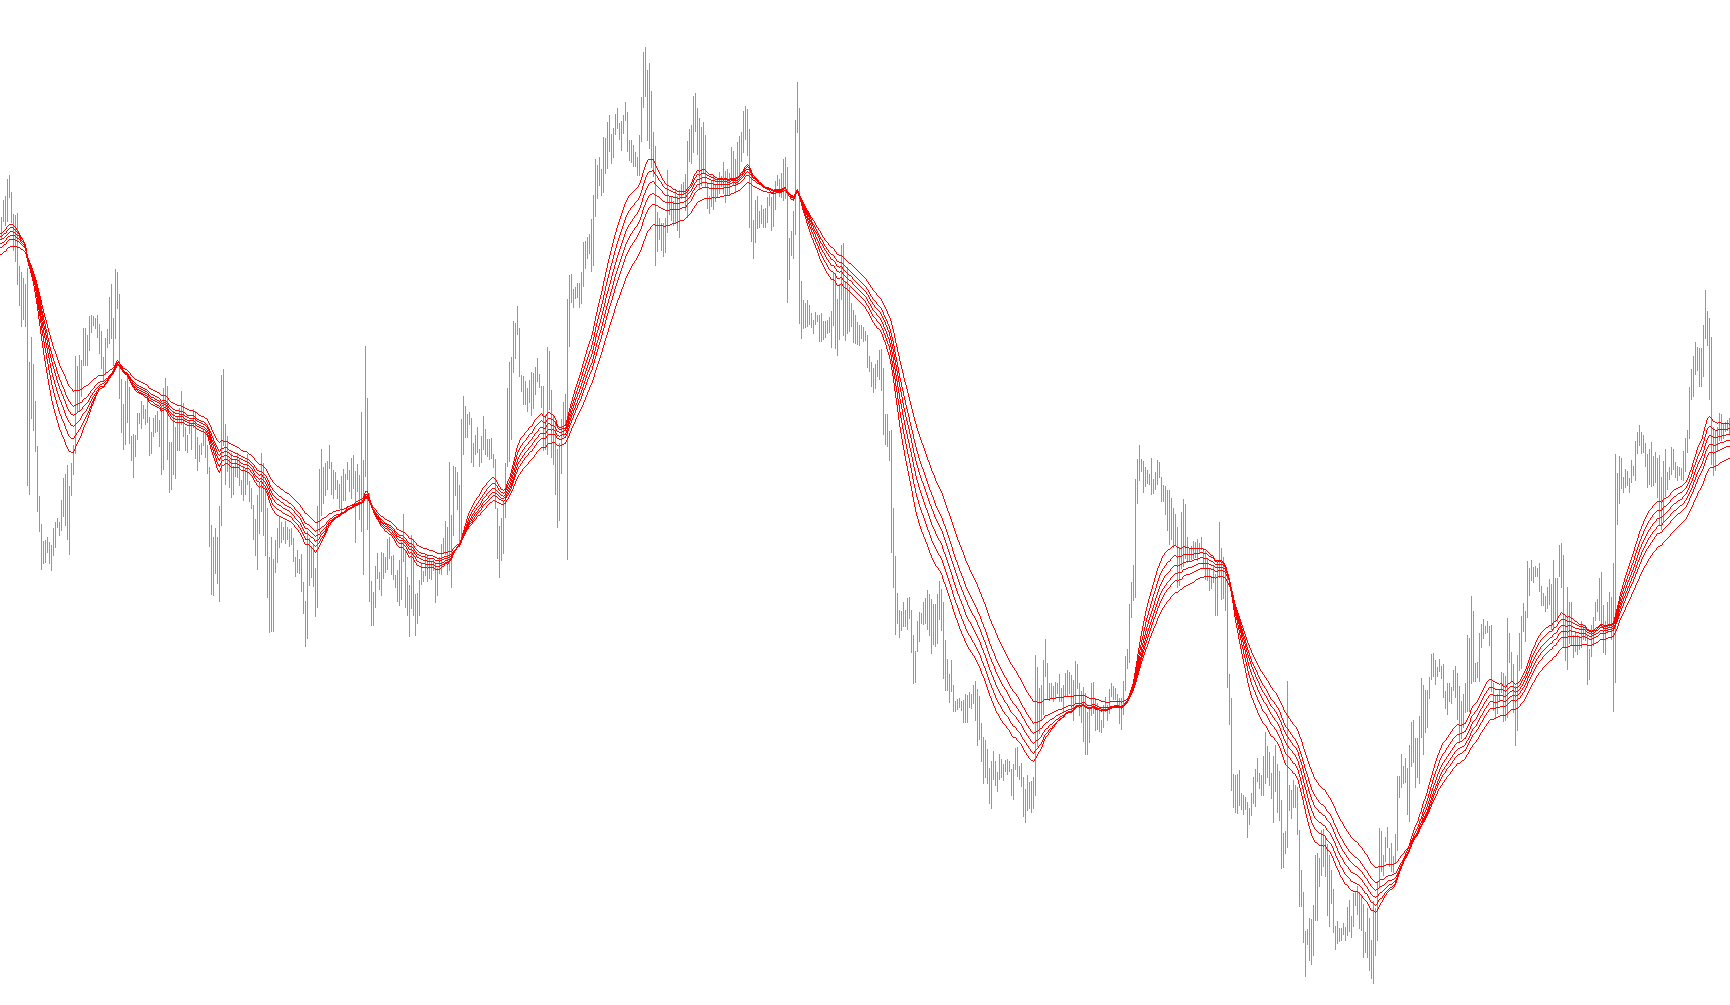
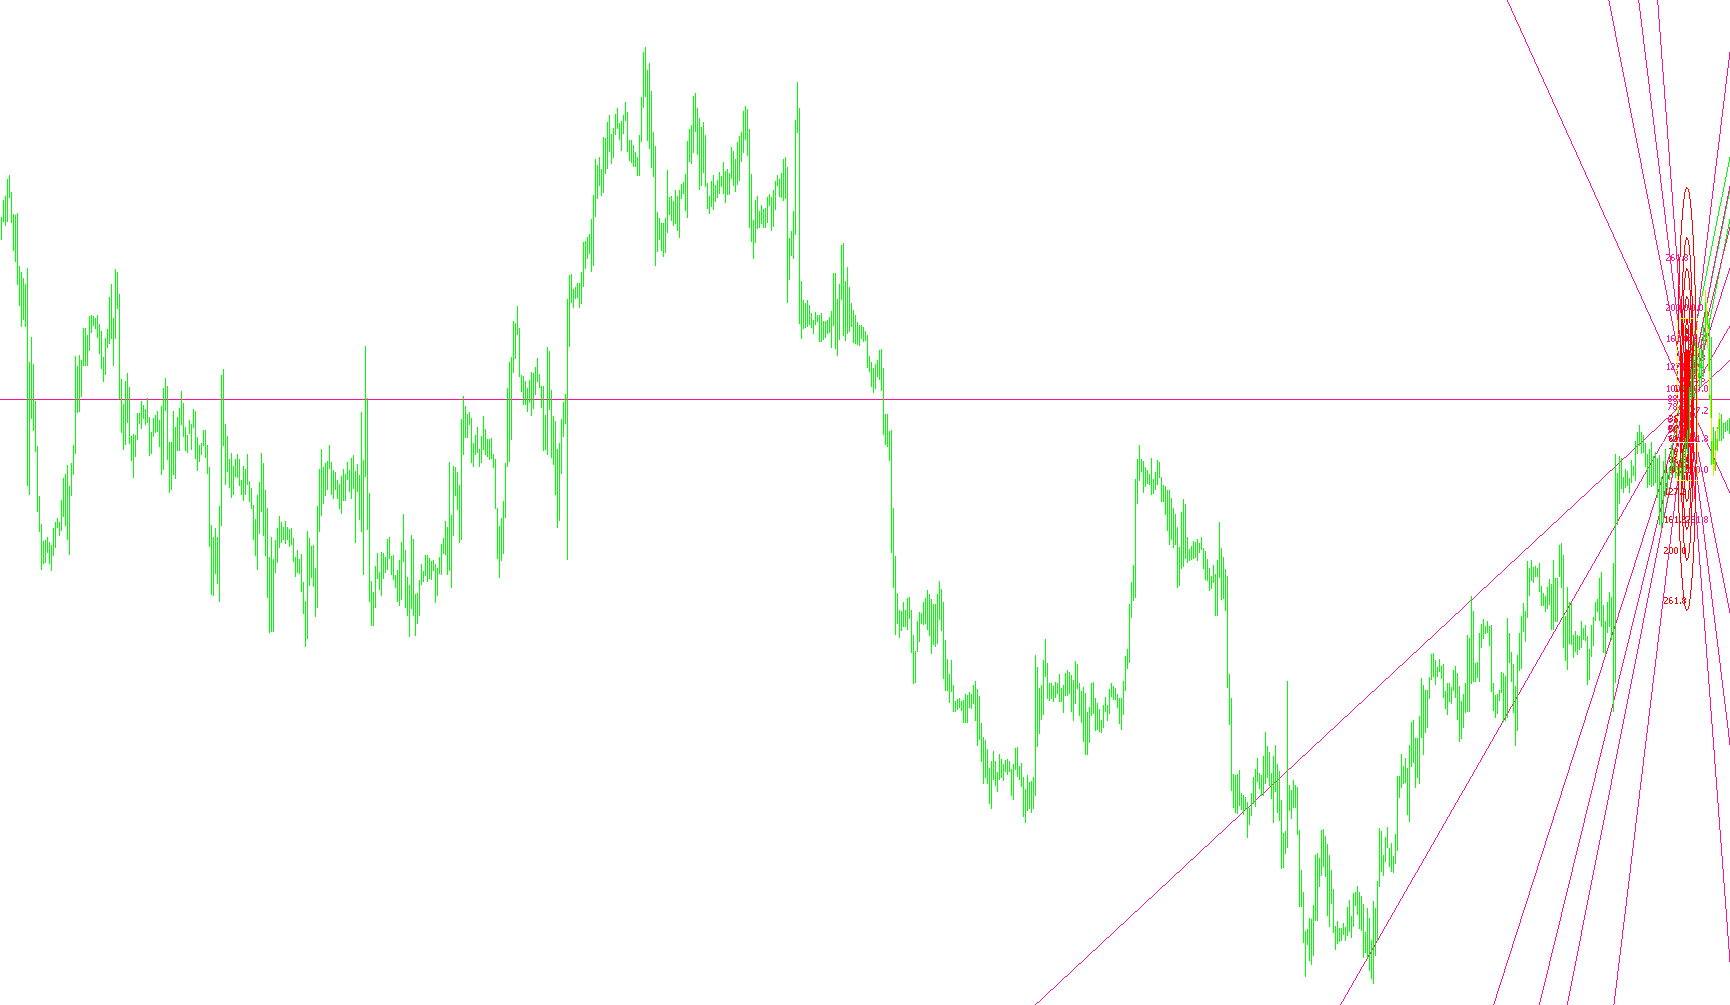
This indicator evaluates concurrent market sentiment by correlating Parabolic SAR price positioning with ADX directional momentum across nine distinct temporal scales.

GiantBarV01
Indicator

GiantBarV01

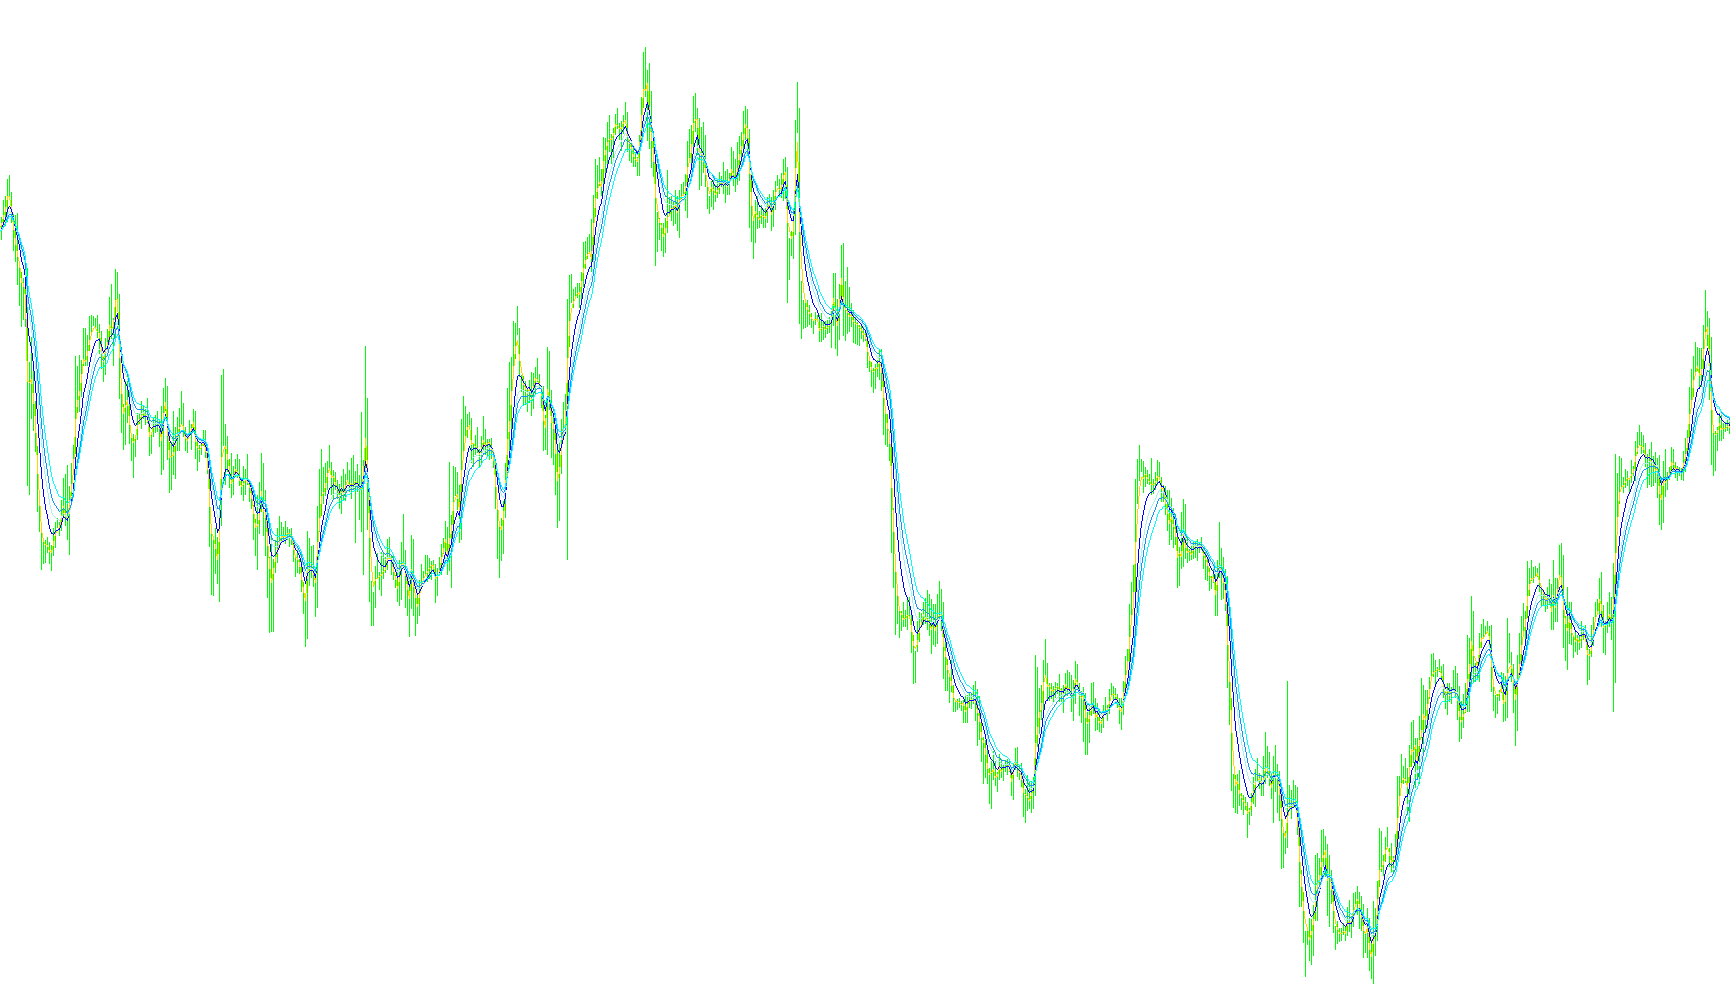
This indicator monitors real-time price action to trigger alerts when the current candle's body exceeds a predefined pip threshold, filtering for significant volatility movements.

GiantBarV03
Indicator

GiantBarV03

Identifies and alerts on price candles that exceed a specific point-based height threshold while implementing a time-based cooldown to filter consecutive signals.

GiantBarV03Arrows
Indicator

GiantBarV03Arrows

This indicator identifies significant price expansions by triggering alerts and visual markers when a single candle's body exceeds a predefined pip threshold.

Gideon's_ATR
Indicator

Gideon's_ATR

iATRiMAOnArray

This indicator quantifies relative market volatility by calculating the quotient of a short-term Average True Range over a long-term Average True Range, followed by a Smoothed Moving Average of that ratio.

Gideon's_ATR_v1
Indicator

Gideon's_ATR_v1

iATRiMAOnArray

This indicator quantifies market instability by calculating the quotient of short-term versus long-term Average True Ranges and smoothing the resulting ratio via a Simple Moving Median Average.

GimmeeBar
Indicator

GimmeeBar

iBands

This indicator identifies potential reversal points by detecting bearish and bullish price action shifts where candlesticks pierce the Bollinger Band boundaries against prevailing trends.

Gliding_Channels_[CF]_v2
Indicator

Gliding_Channels_[CF]_v2

This indicator identifies market trend structures by projecting linear channels based on the three most recent significant price pivots, utilizing candle wick extremes to define boundary slopes.

GLORINIKA_en
Indicator

GLORINIKA_en

This indicator visualizes daily price ranges, Fibonacci retracements, and multi-timeframe open/close levels to provide comprehensive structural context for entry precision.

Indicator

GMACD2

iMACD
Indicator

Gmacd2_v1

iMACD
GMACD_Signals
Indicator

GMACD_Signals

iMACD

This indicator harmonizes MACD velocity across diverse temporal horizons to categorize market regimes into precise strength levels and directional biases.

GMACD_Signals_v1
Indicator

GMACD_Signals_v1

iMACD

This indicator aggregates MACD signal data across multiple timeframes to categorize market conditions into directional trends, consolidation zones, and structural strength levels.

GMACD_Signals_v2
Indicator

GMACD_Signals_v2

iMACD

This indicator synthesizes MACD data across multiple timeframes to identify concurrent trend alignment, structural strength, and potential price corrections.

GMMA Long
Indicator

GMMA Long

iMA

This indicator identifies long-term structural trends by plotting a series of synchronized exponential moving averages to visualize collective institutional price flow.

GMMA Long_v1
Indicator

GMMA Long_v1

iMA

This indicator projects six distinct exponential moving averages ranging from 30 to 60 periods to visualize multi-layered trend momentum and price equilibrium.

GMMA Long_v2
Indicator

GMMA Long_v2

iMA

This indicator visualizes the interplay of six sequential exponential moving averages to identify structural trend transitions and price momentum.

GMMA Long_v3
Indicator

GMMA Long_v3

iMA

This indicator synthesizes six distinct exponential moving averages to visualize institutional trend strength and long-cycle momentum shifts.

GMMA Long_v4
Indicator

GMMA Long_v4

iMA

This indicator visualizes the convergence and divergence of six high-period exponential moving averages to identify structural trend shifts and momentum stability.

GMMA Sashken_v1
Indicator

GMMA Sashken_v1

iMA

This indicator projects a series of progressive moving averages with incremental periods to visualize trend synchronization and momentum shifts.

GMMA Short
Indicator

GMMA Short

iMA

This indicator visualizes a tight cluster of five exponential moving averages with periods ranging from 3 to 15 to identify short-term price momentum and trend cohesion.

GMMA Short_v1
Indicator

GMMA Short_v1

iMA

This indicator identifies immediate price momentum by calculating a cluster of five short-period exponential moving averages to visualize localized trend cohesion.

GMMA Short_v2
Indicator

GMMA Short_v2

iMA

This indicator visualizes high-frequency trend dynamics by clustering five rapid exponential moving averages to identify short-term price velocity and structural alignment.
GMMA Short_v3
Indicator

GMMA Short_v3

iMA

This indicator utilizes a cluster of five short-term exponential moving averages to identify immediate price velocity and trend synchronization.
GMMA Short_v4
Indicator

GMMA Short_v4

iMA

This indicator visualizes immediate price momentum by layering five rapid Exponential Moving Averages to identify short-term trend velocity and structural shifts.

GMMAShort6
Indicator

GMMAShort6

iMA

This indicator visualizes a high-frequency convergence of six nested exponential moving averages to identify immediate momentum shifts and micro-trend alignment.

GMMA_Long
Indicator

GMMA_Long

iMA

This indicator identifies structural market shifts by plotting a cluster of six exponential moving averages spanning the 30 to 60 period range to visualize macro trend synchronization.

GMMA_Long_v1
Indicator

GMMA_Long_v1

iMA

This indicator identifies structural bullish sentiment by plotting a cluster of six progressive exponential moving averages to visualize medium and long-term price momentum.

GMMA_Short
Indicator

GMMA_Short

iMA

This indicator evaluates immediate price velocity by overlaying a dense cluster of five exponential moving averages to identify short-term trend alignment.

GMMA_Short_v1
Indicator

GMMA_Short_v1

iMA

This tool analyzes short-term price velocity by aggregating a cluster of high-frequency exponential moving averages to visualize immediate trend convergence and divergence.

go
Indicator

go

iMA

This indicator calculates a weighted price-action momentum by aggregating the sum of relative price deviations across high, low, open, and close boundaries, scaled by the current bar's trading volume.

Goertzel_Cycle_v1
Indicator

Goertzel_Cycle_v1

This indicator decomposes price action into constituent cycles by applying the Goertzel algorithm to identify dominant frequencies, amplitudes, and phase shifts.

Gold Spread of Williams
Indicator

Gold Spread of Williams

iMAOnArray

This indicator calculates the price differential between a specified external currency index and the current asset to identify relative strength shifts through a smoothed SMA crossover of the spread.

Golden Finger
Indicator

Golden Finger

iWPR
Golden_section_v2(4)
Indicator

Golden_section_v2(4)

This indicator dynamically identifies pivot points via a ZigZag algorithm to project Fibonacci fans, arcs, rectangles, and channels based on structural market geometry.

Golden_section_v2.2
Indicator

Golden_section_v2.2

An automated technical analysis tool that identifies price extremes using a recursive fractal logic to project Fibonacci-based harmonic structures including fans, arcs, and pitchforks.

Golden_section_v21.2
Indicator

Golden_section_v21.2

This indicator identifies structural pivot points using a ZigZag algorithm to automatically project complex harmonic geometry, including Fibonacci fans, pitchforks, arcs, and multi-level expansion channels.

goldminer1
Indicator

goldminer1

iWPR

This indicator identifies potential trend exhaustion points by cross-referencing dynamic volatility thresholds with Williams Percentage Range momentum shifts.

Gold_Silver_Ratio
Indicator

Gold_Silver_Ratio

This indicator visualizes the real-time price quotient between two distinct assets by mapping their relative high and low variance as vertical trend lines.

Good_Macd dark screen
Indicator

Good_Macd dark screen

iMA

The algorithm quantifies price velocity by calculating the divergence between two exponential moving averages and overlaying a smoothed signal line to identify trend momentum.

Good_Macd dark screen_v1
Indicator

Good_Macd dark screen_v1

iMA

This indicator quantifies relative price velocity by calculating the differential between dual exponential moving averages and generating a smoothed signal line for momentum tracking.

Good_Macd
Indicator

Good_Macd

iMA

Calculates the spread between two exponential moving averages and applies an alpha-weighted smoothing to derive a signal line and histogram for momentum identification.

Good_Macd_v1
Indicator

Good_Macd_v1

iMA

This indicator calculates the spread between two exponential moving averages and filters the resulting momentum through a smoothed signal line to generate a visual histogram of price velocity.

Indicator

gopal

GordagoElder-generated
Indicator

GordagoElder-generated

This strategy identifies long-term trends via H1 MACD momentum, seeks M15 Stochastic oversold recoils for optimal entry points, and executes on M1 price breakouts relative to previous candle highs.

gorillych
Indicator

gorillych

Identifies high-intensity sentiment shifts by calculating the ratio of price range to volume relative to the candle's directional polarity.

GP_Clock~
Indicator

GP_Clock~

A visual dashboard that simultaneously projects real-time remaining candle duration and live market spread dynamics directly onto the price action.

GP_Clock~_002
Indicator

GP_Clock~_002

This indicator calculates the remaining time until the current candlestick closes and displays a live ticking clock on the chart.