FX_Sniper's_Ergodic_CCI_Trigger
Indicator

FX_Sniper's_Ergodic_CCI_Trigger

iMAOnArray

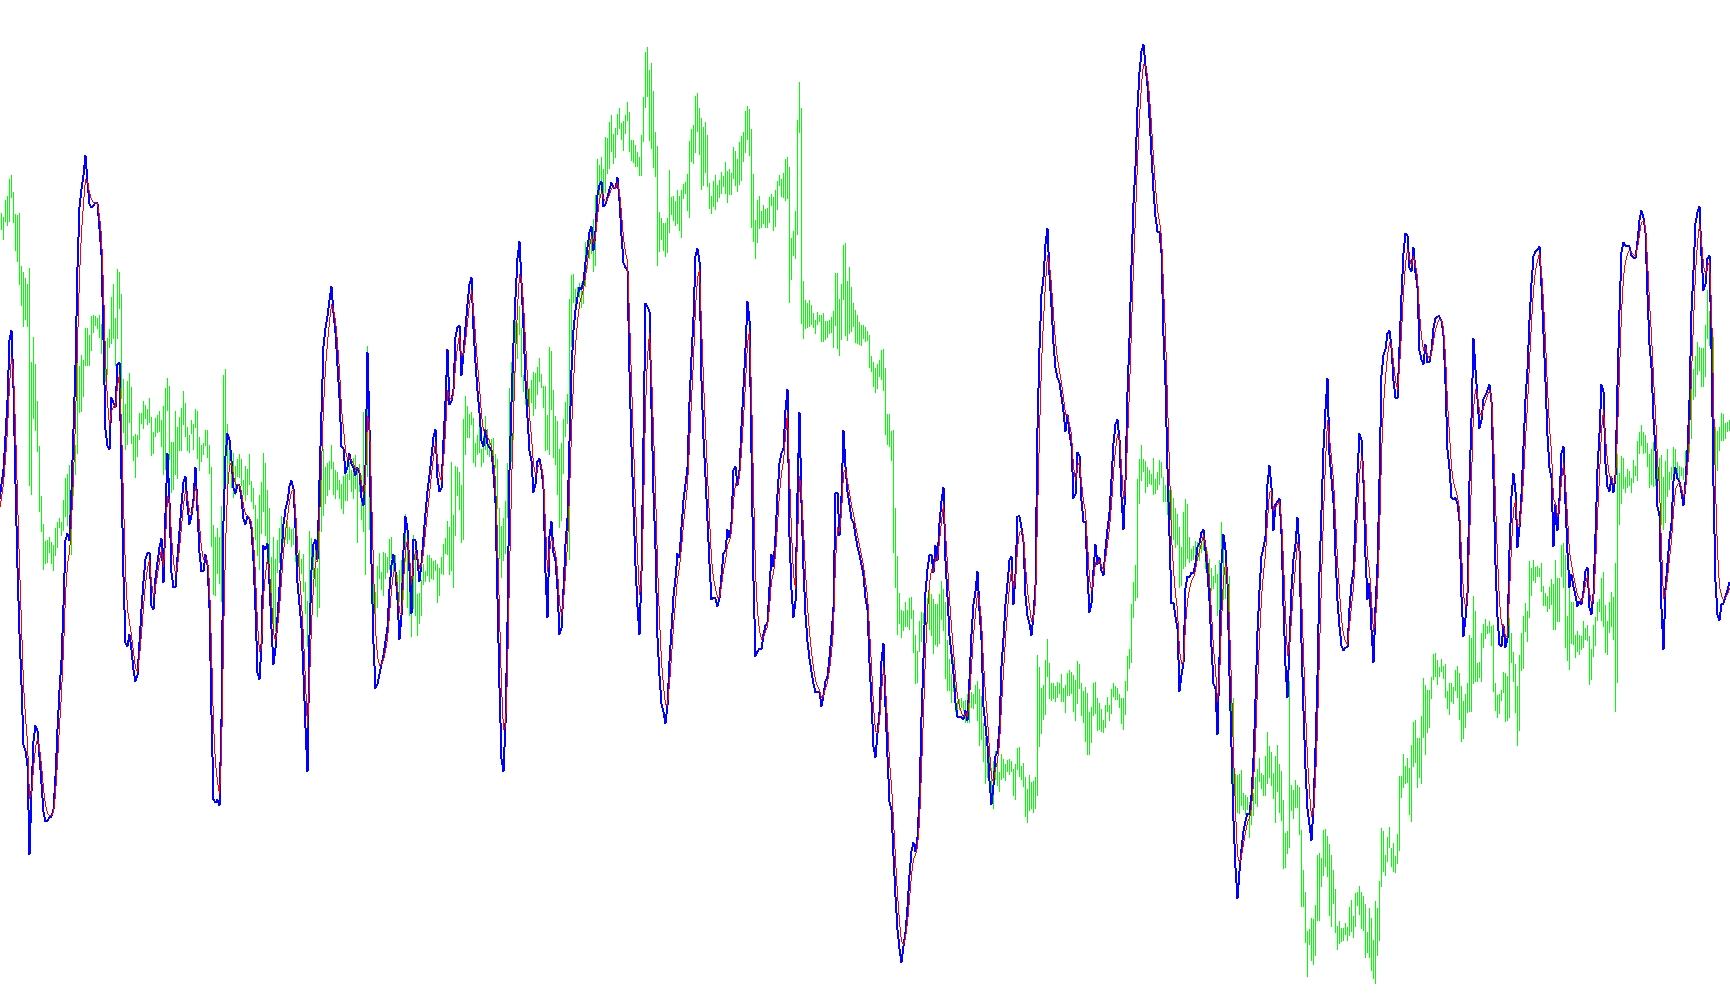
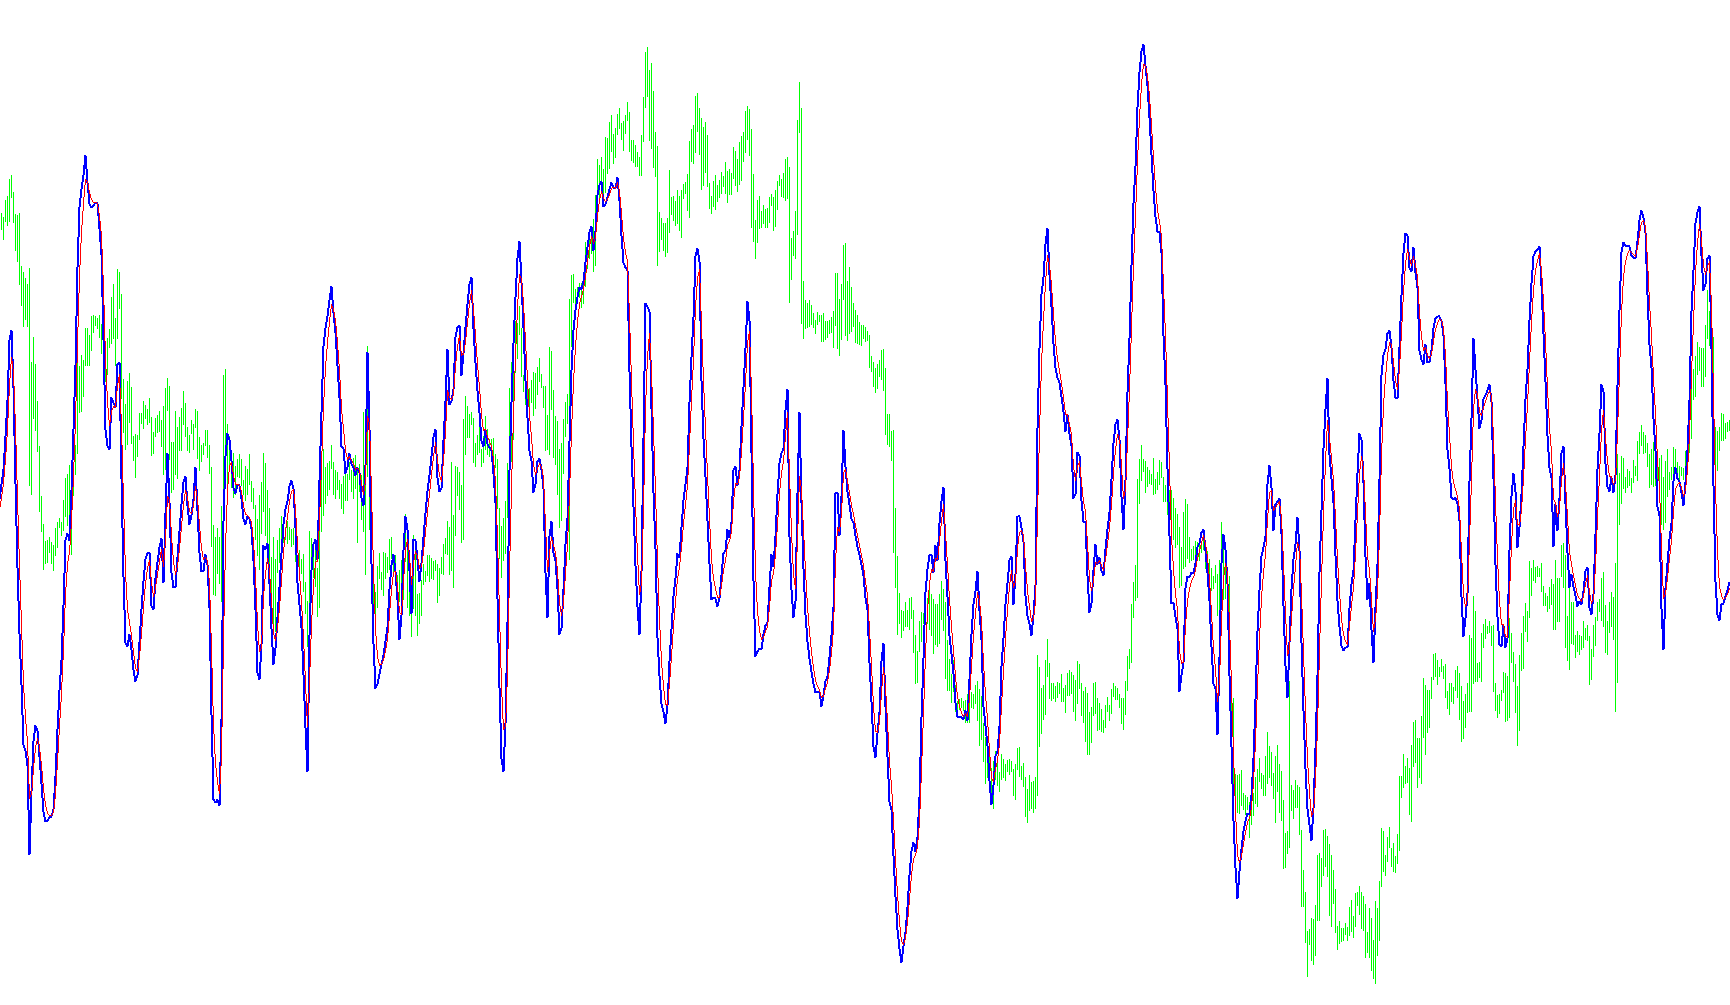
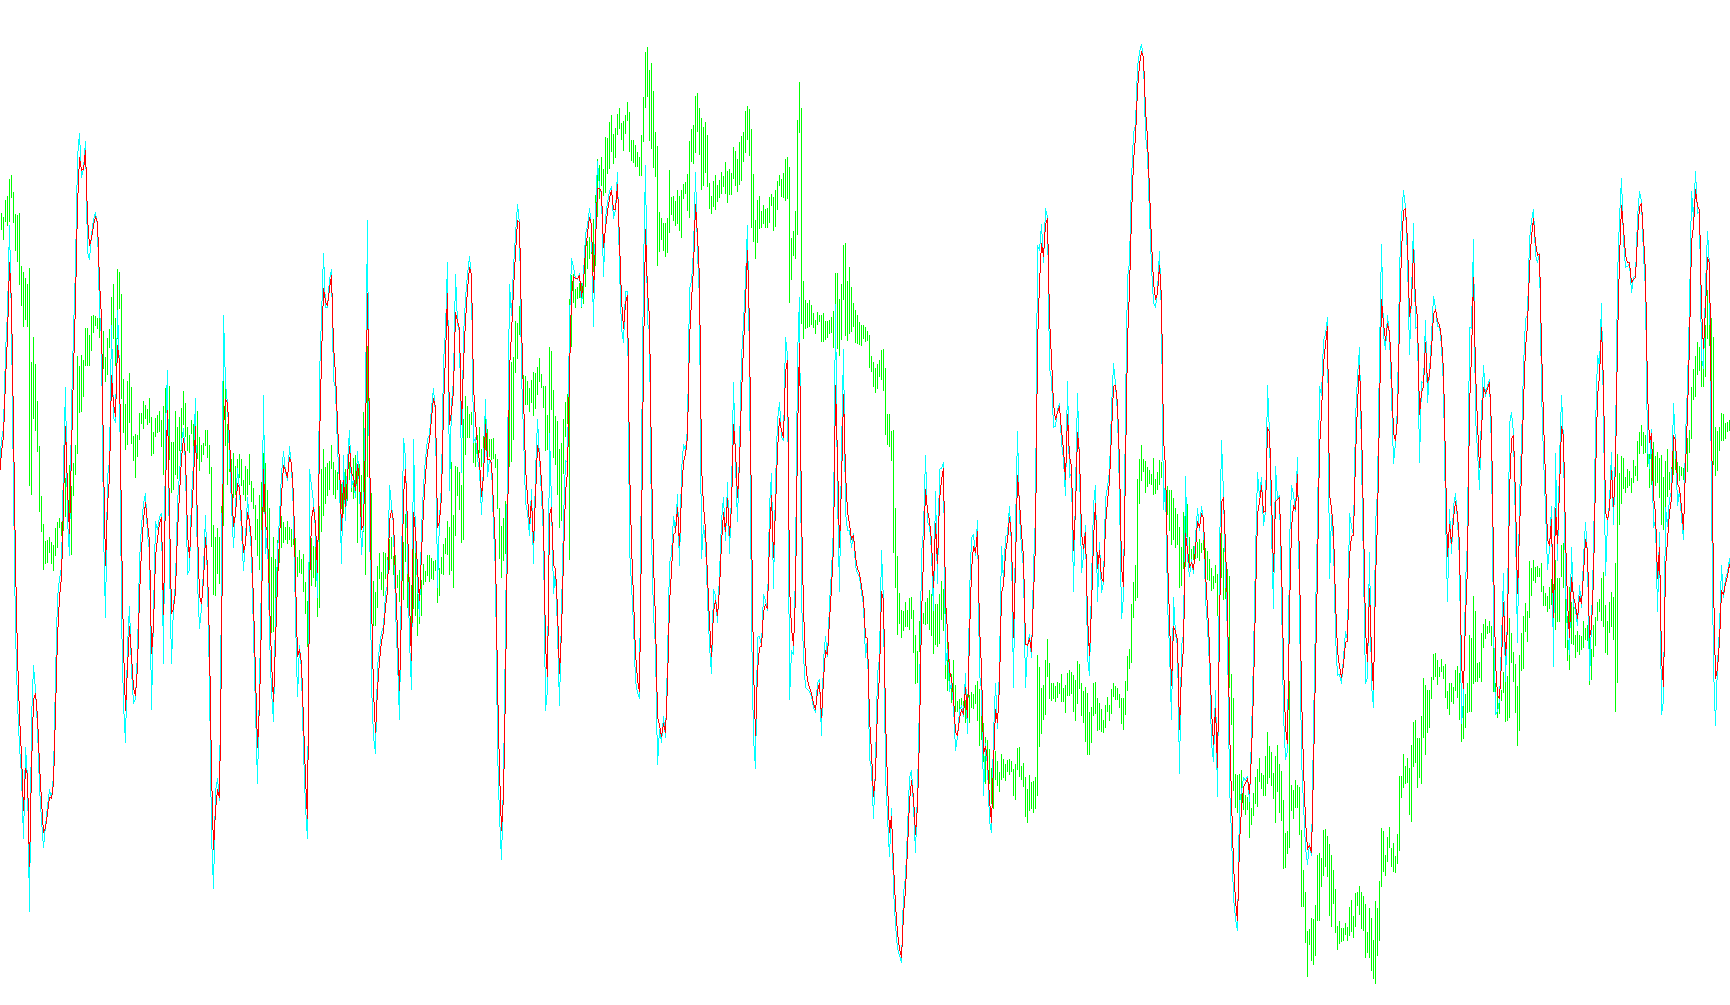
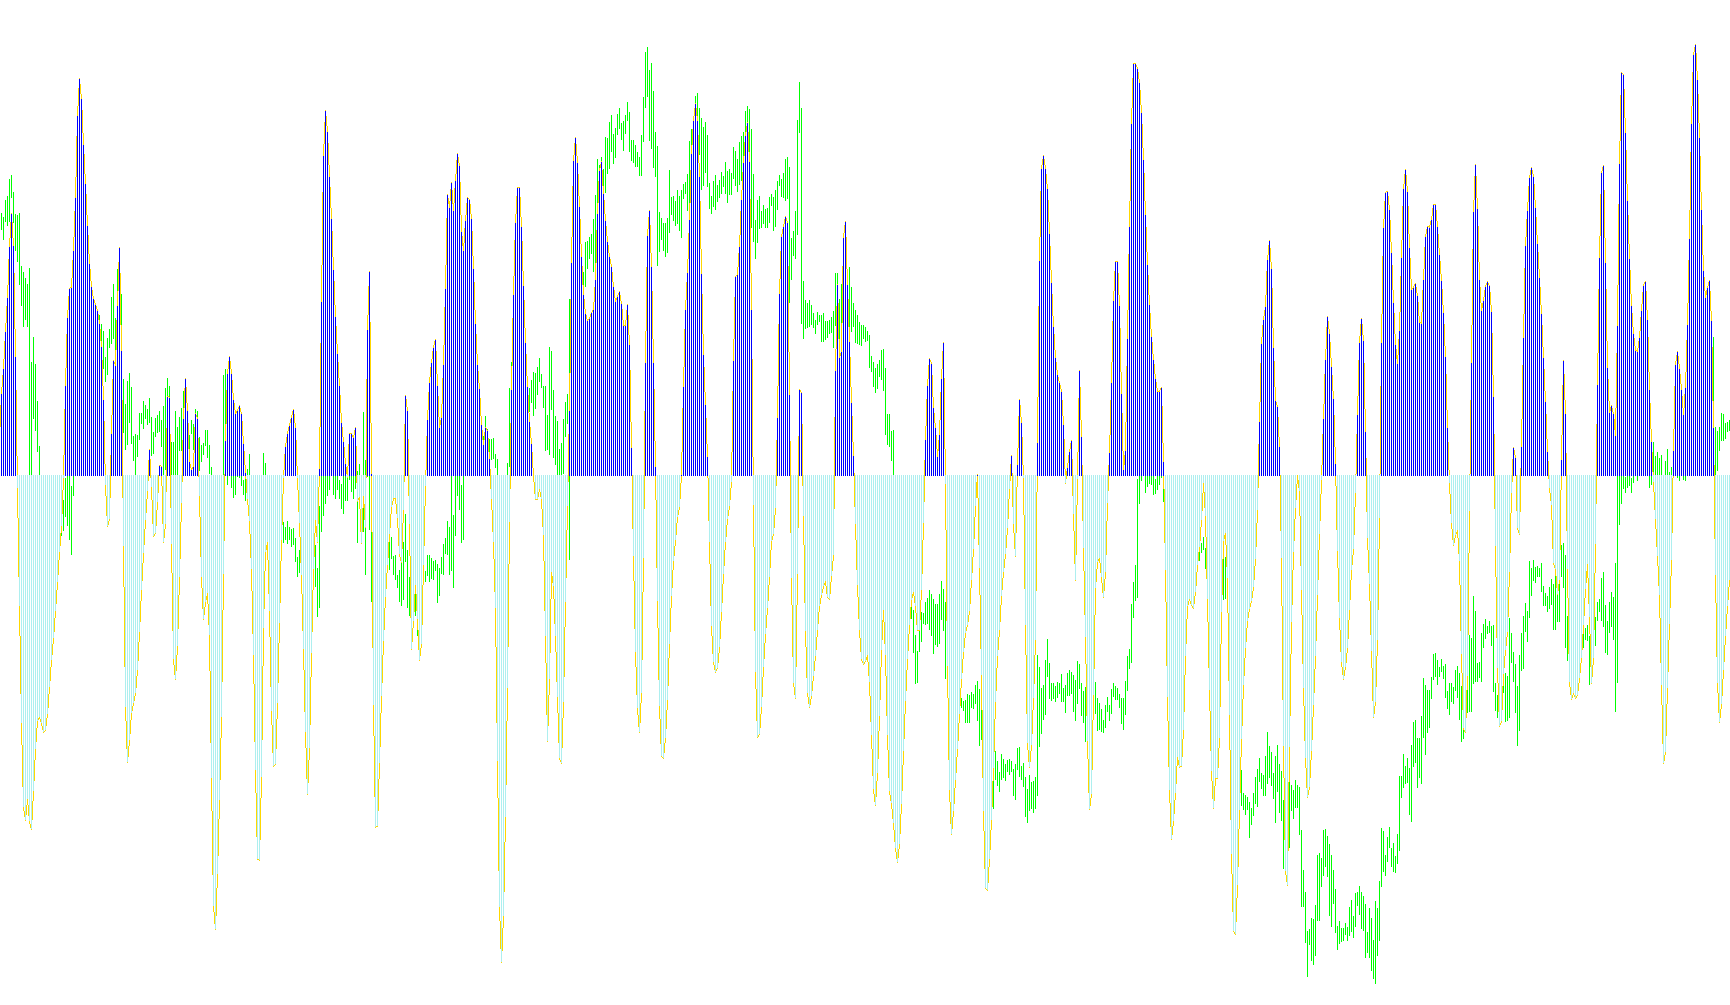
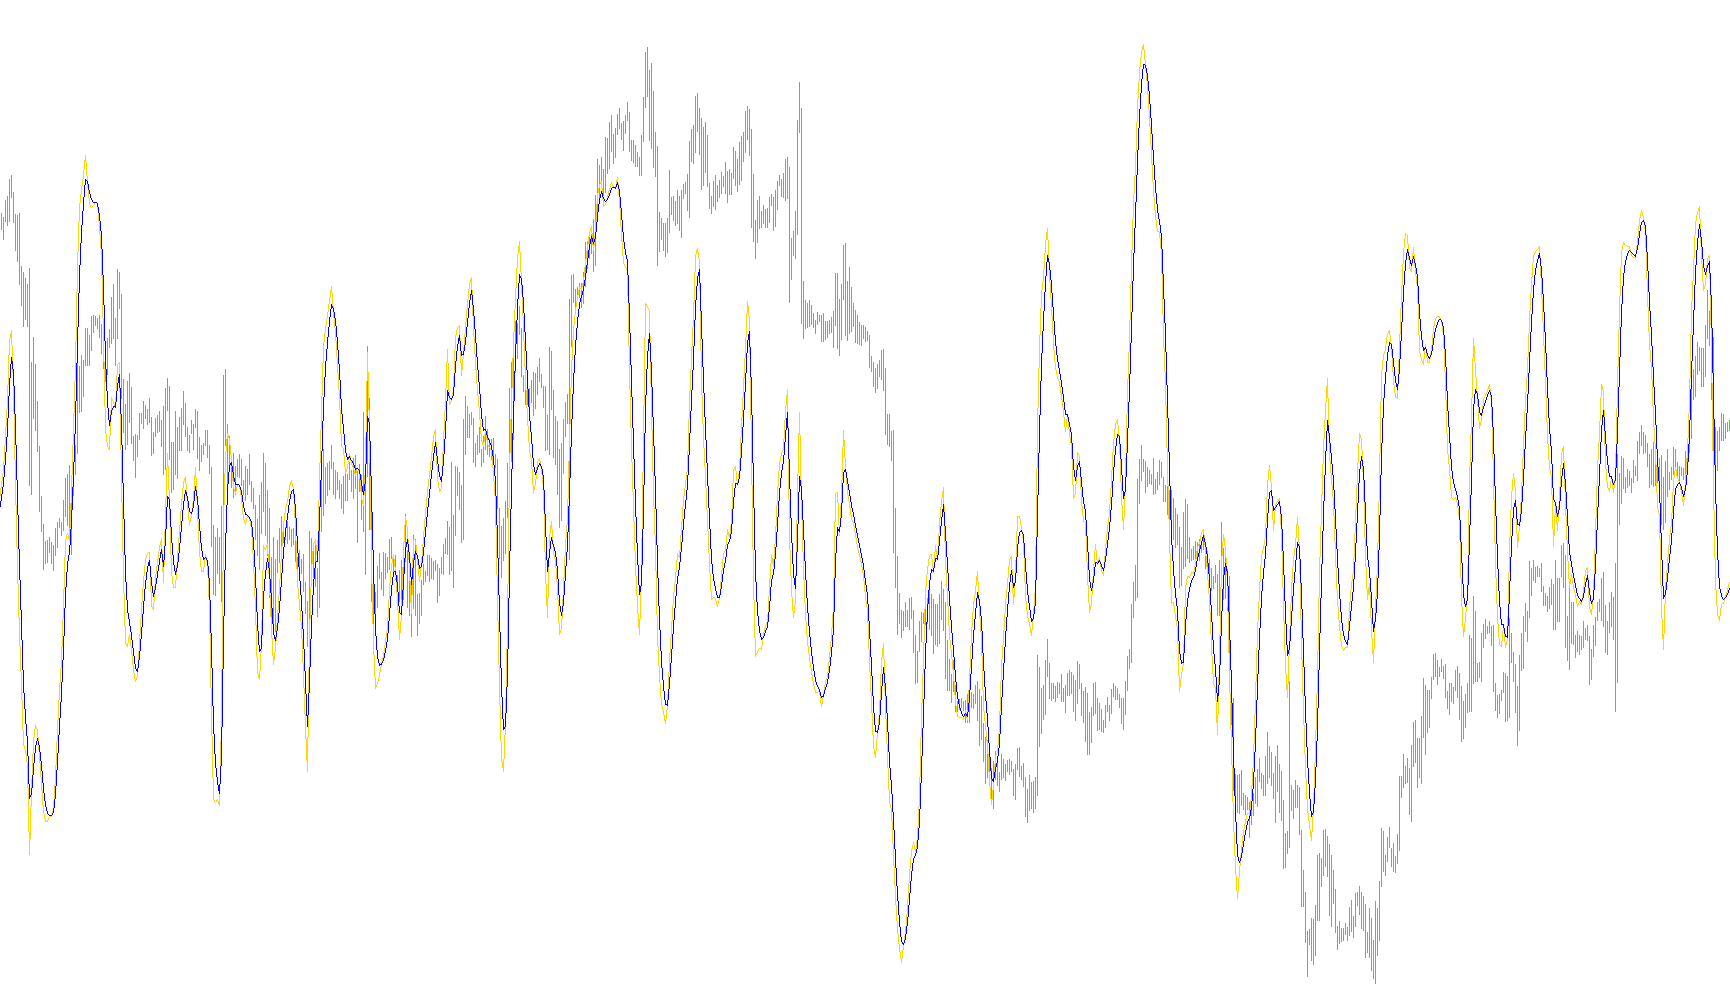
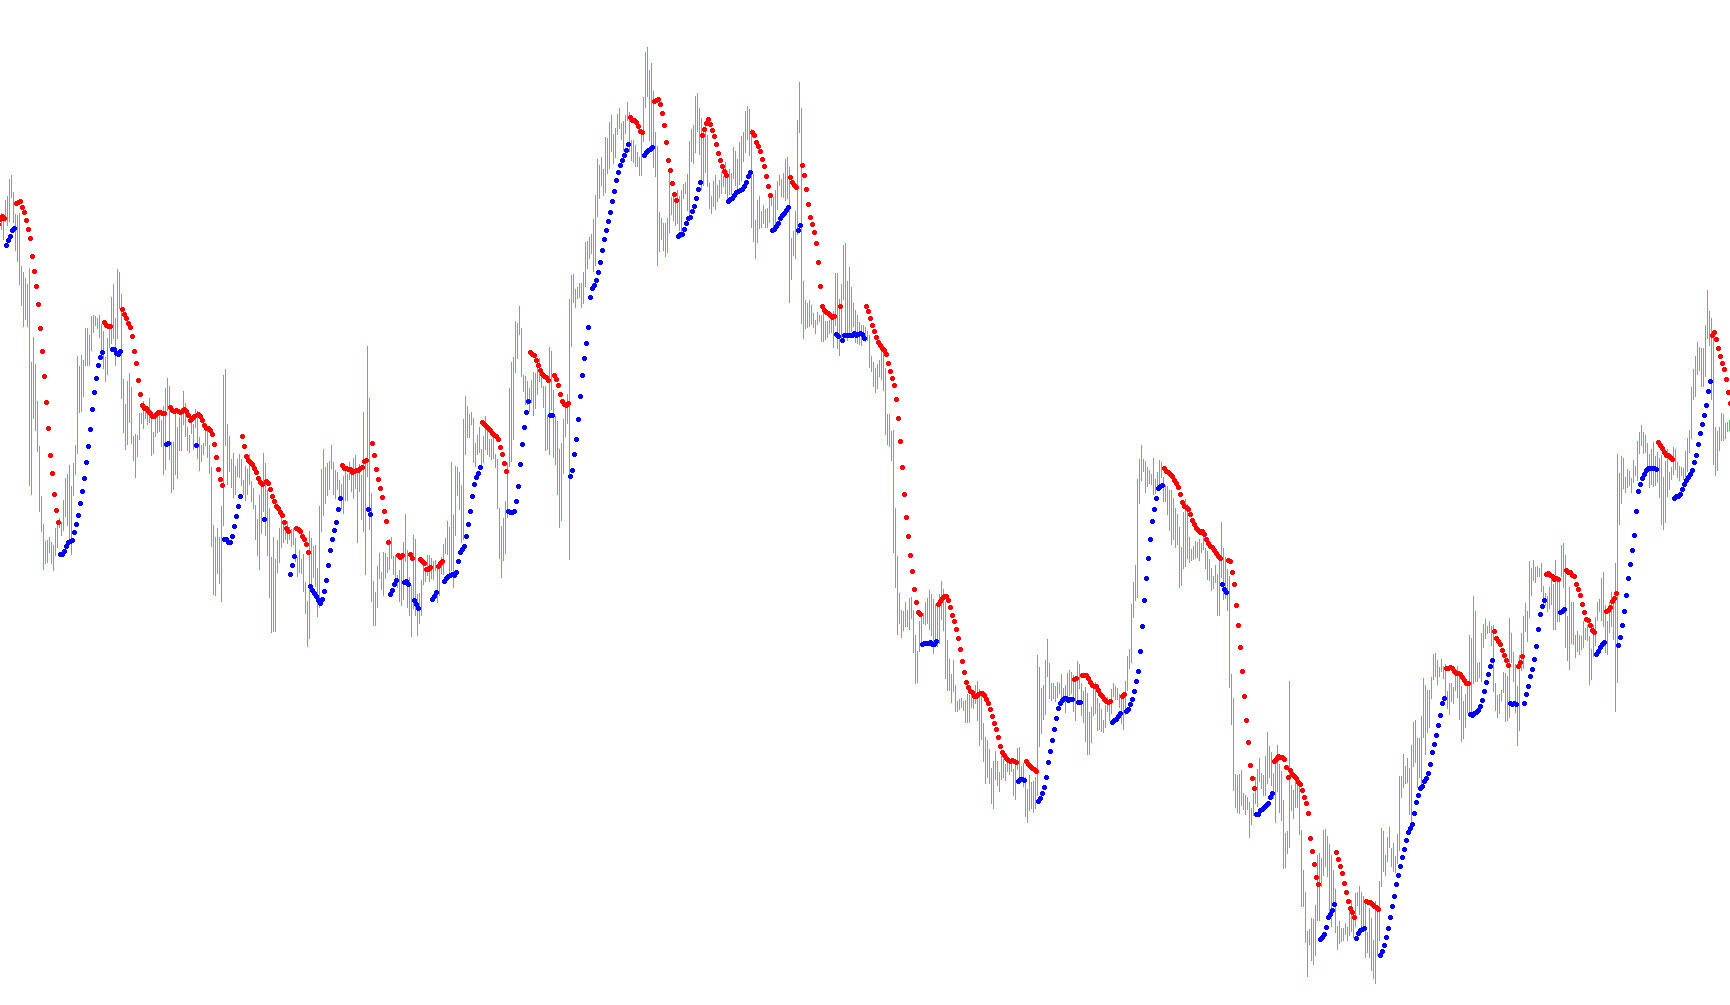
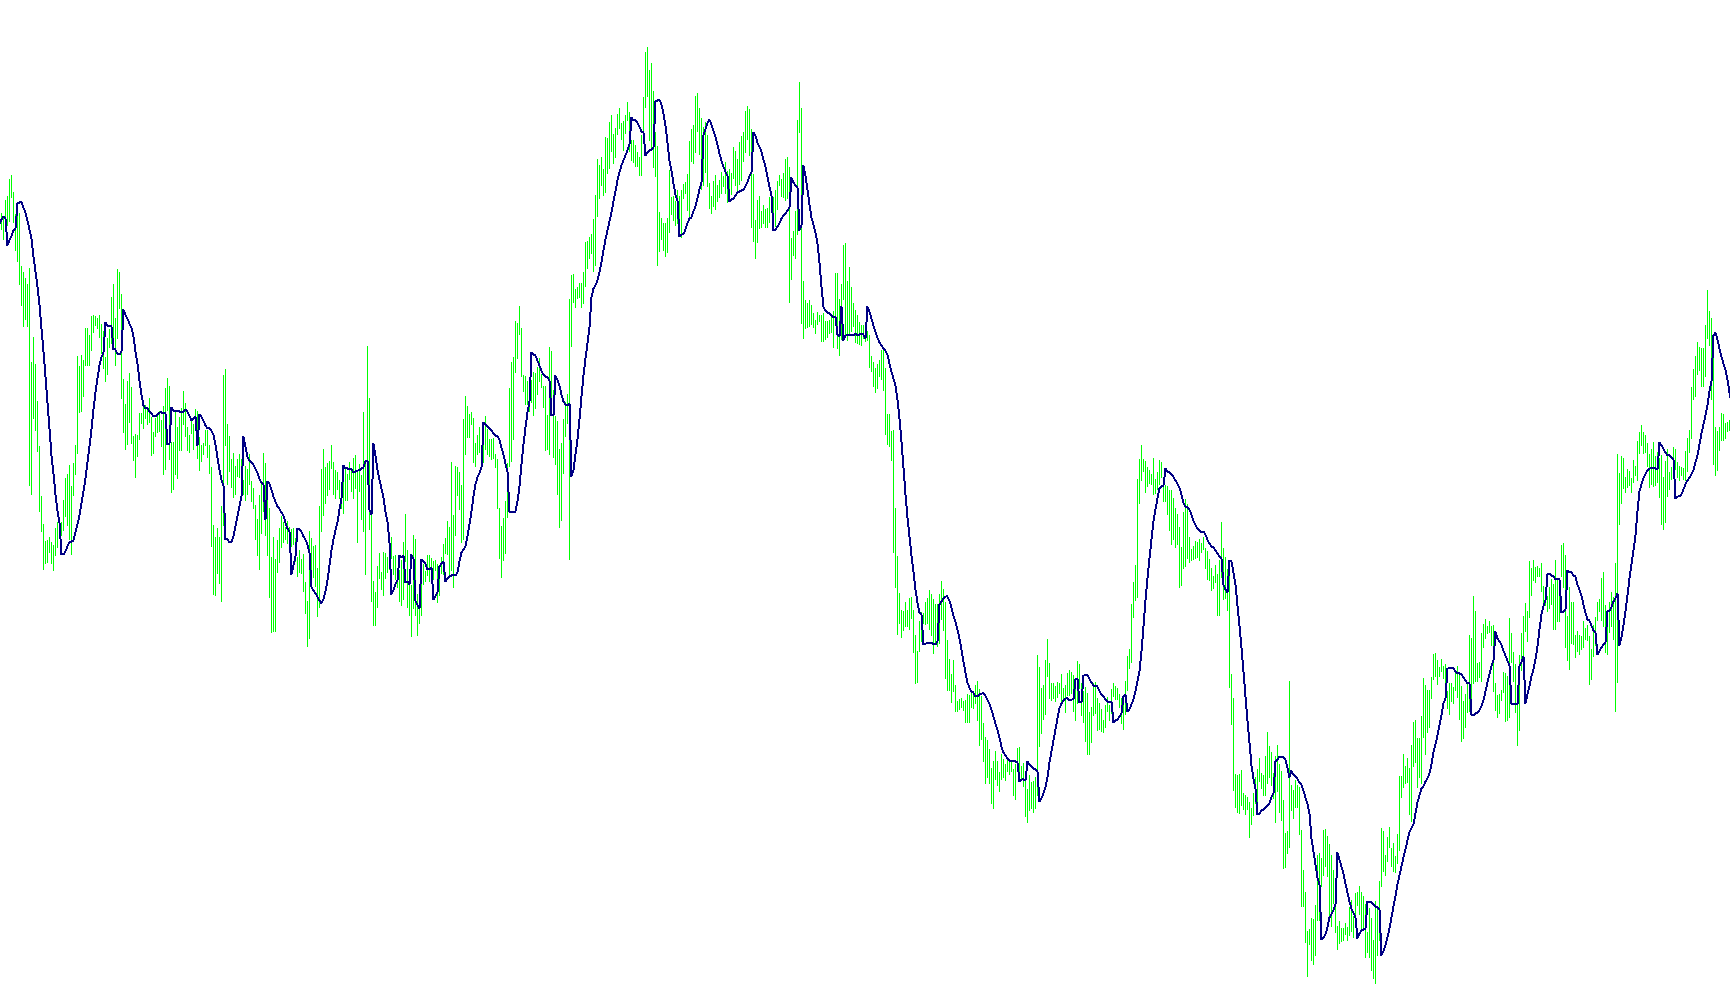
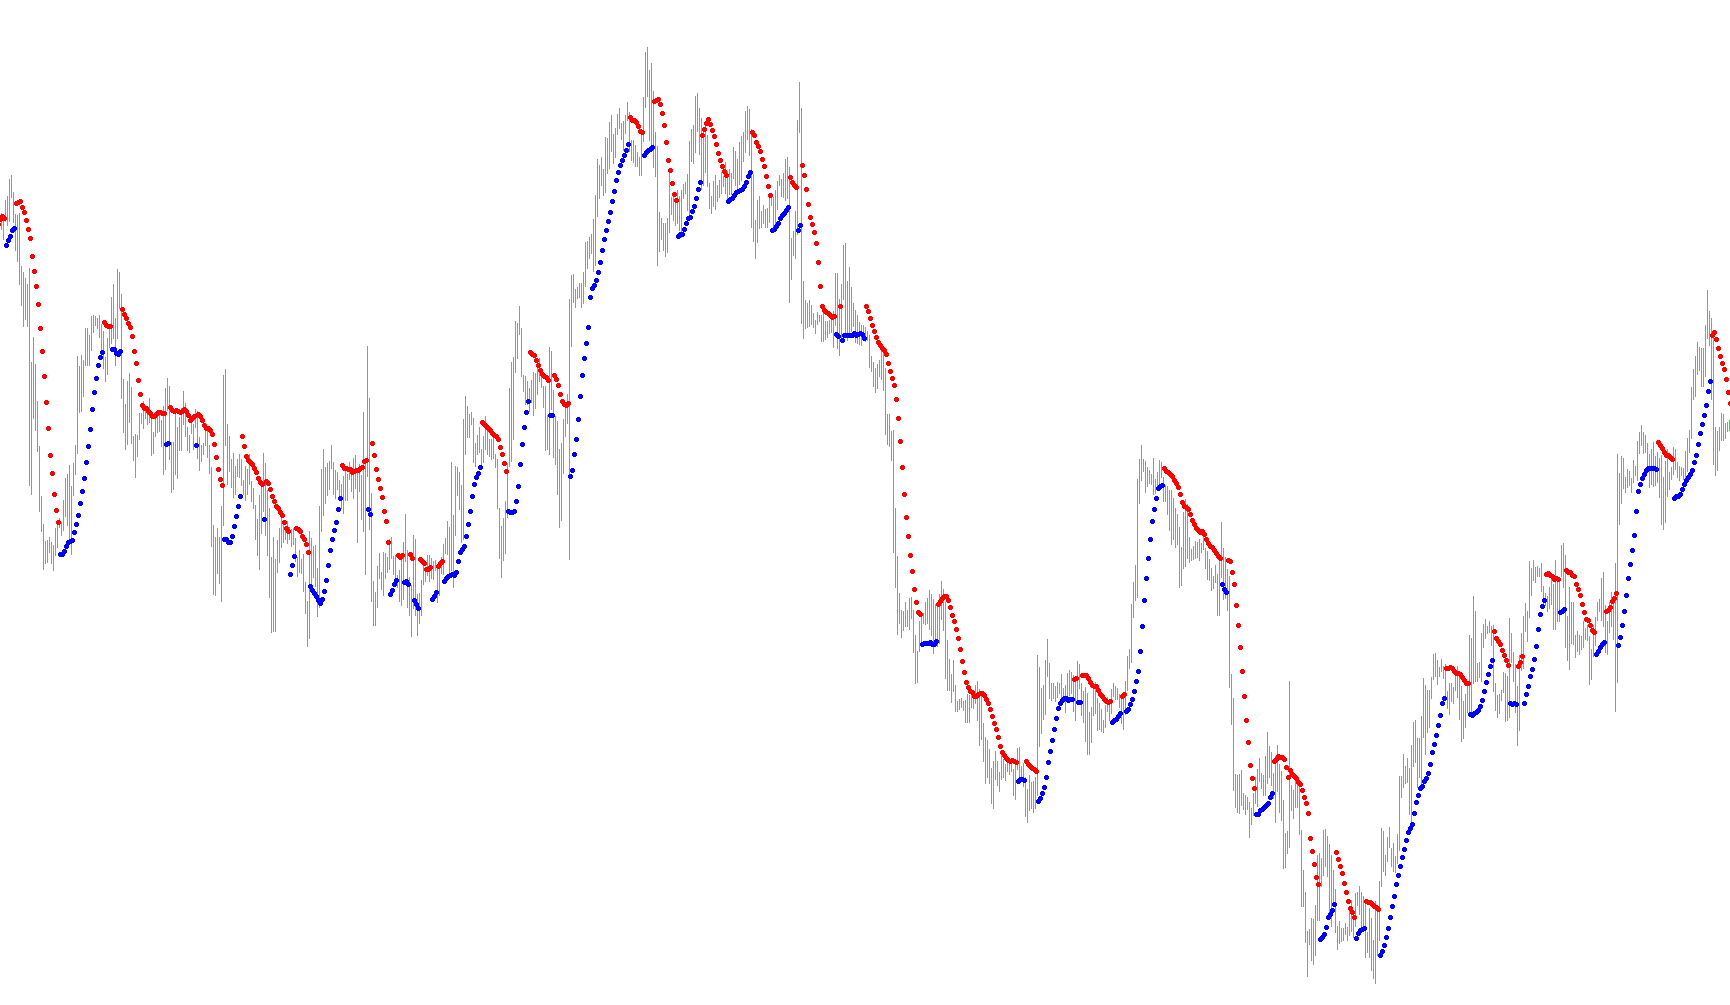
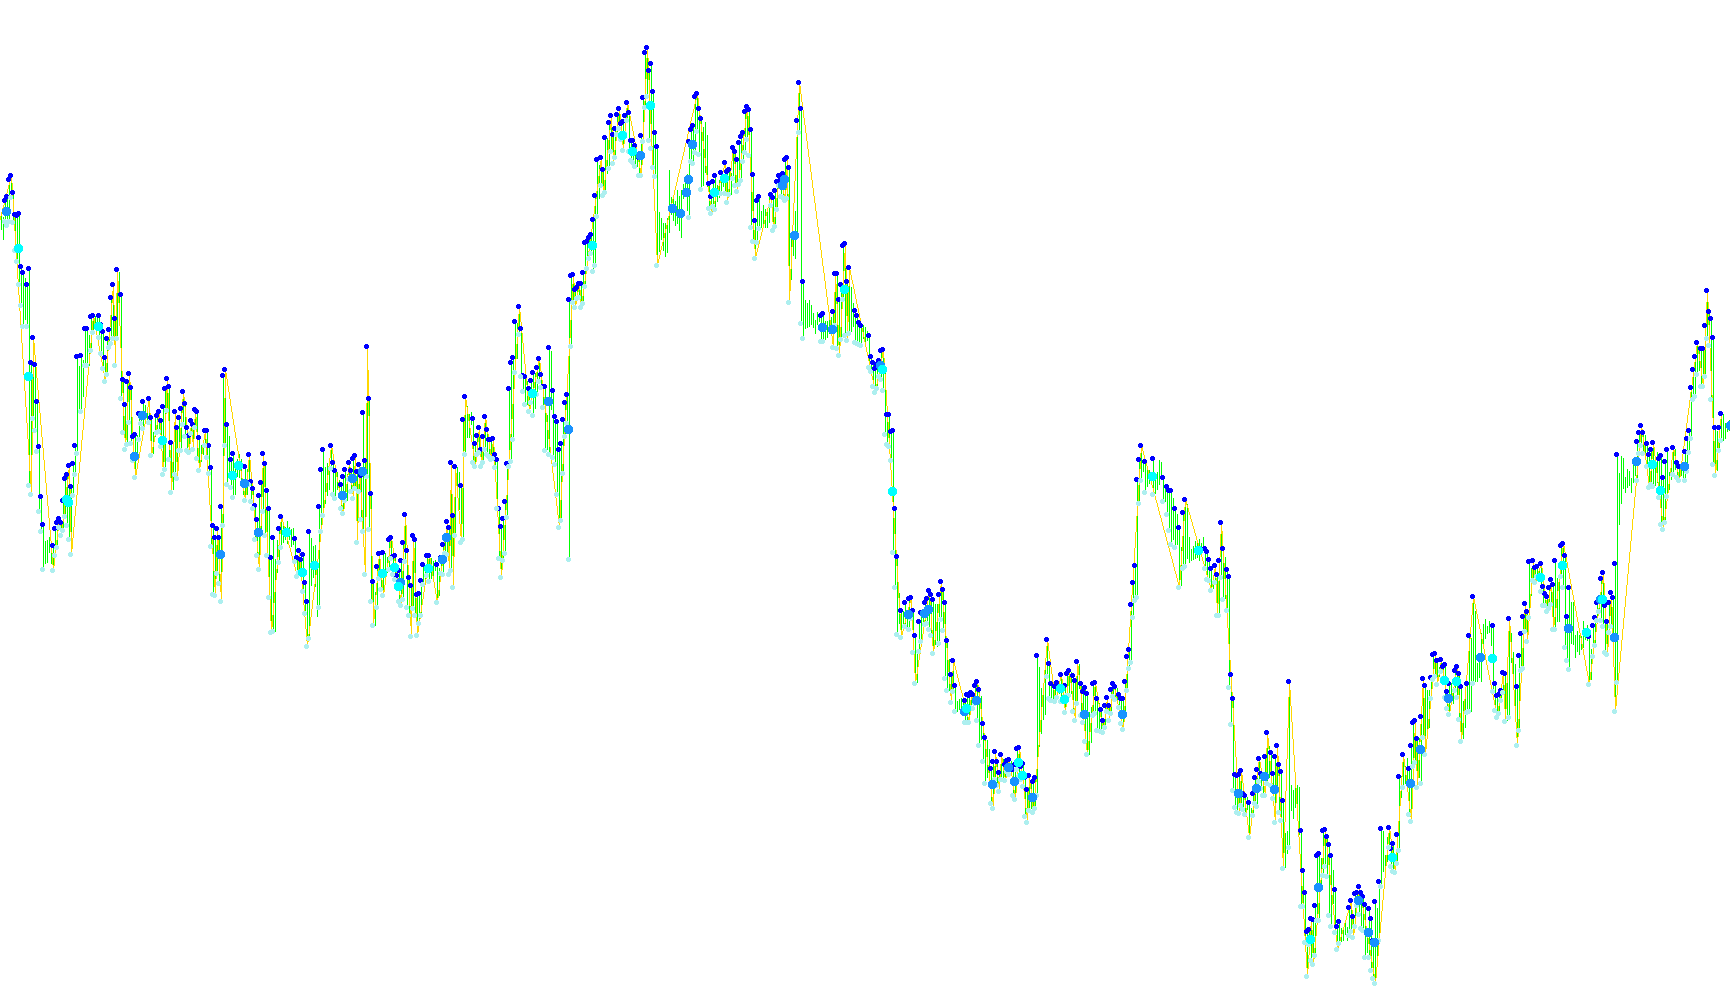
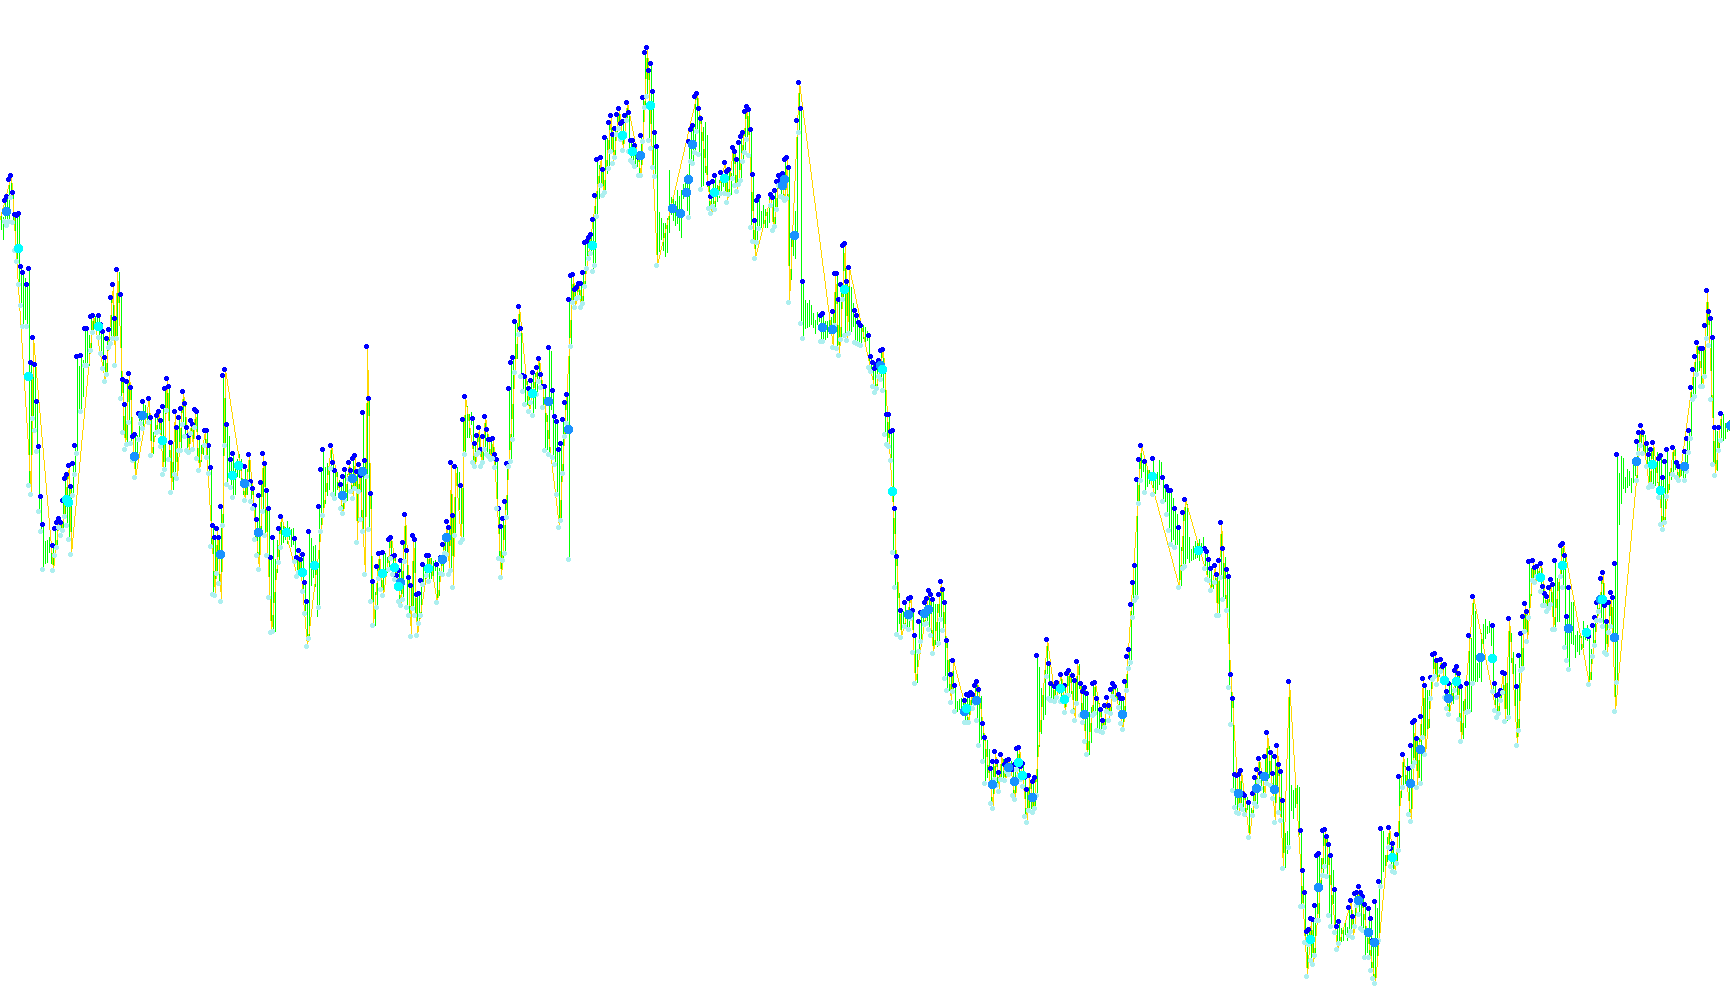
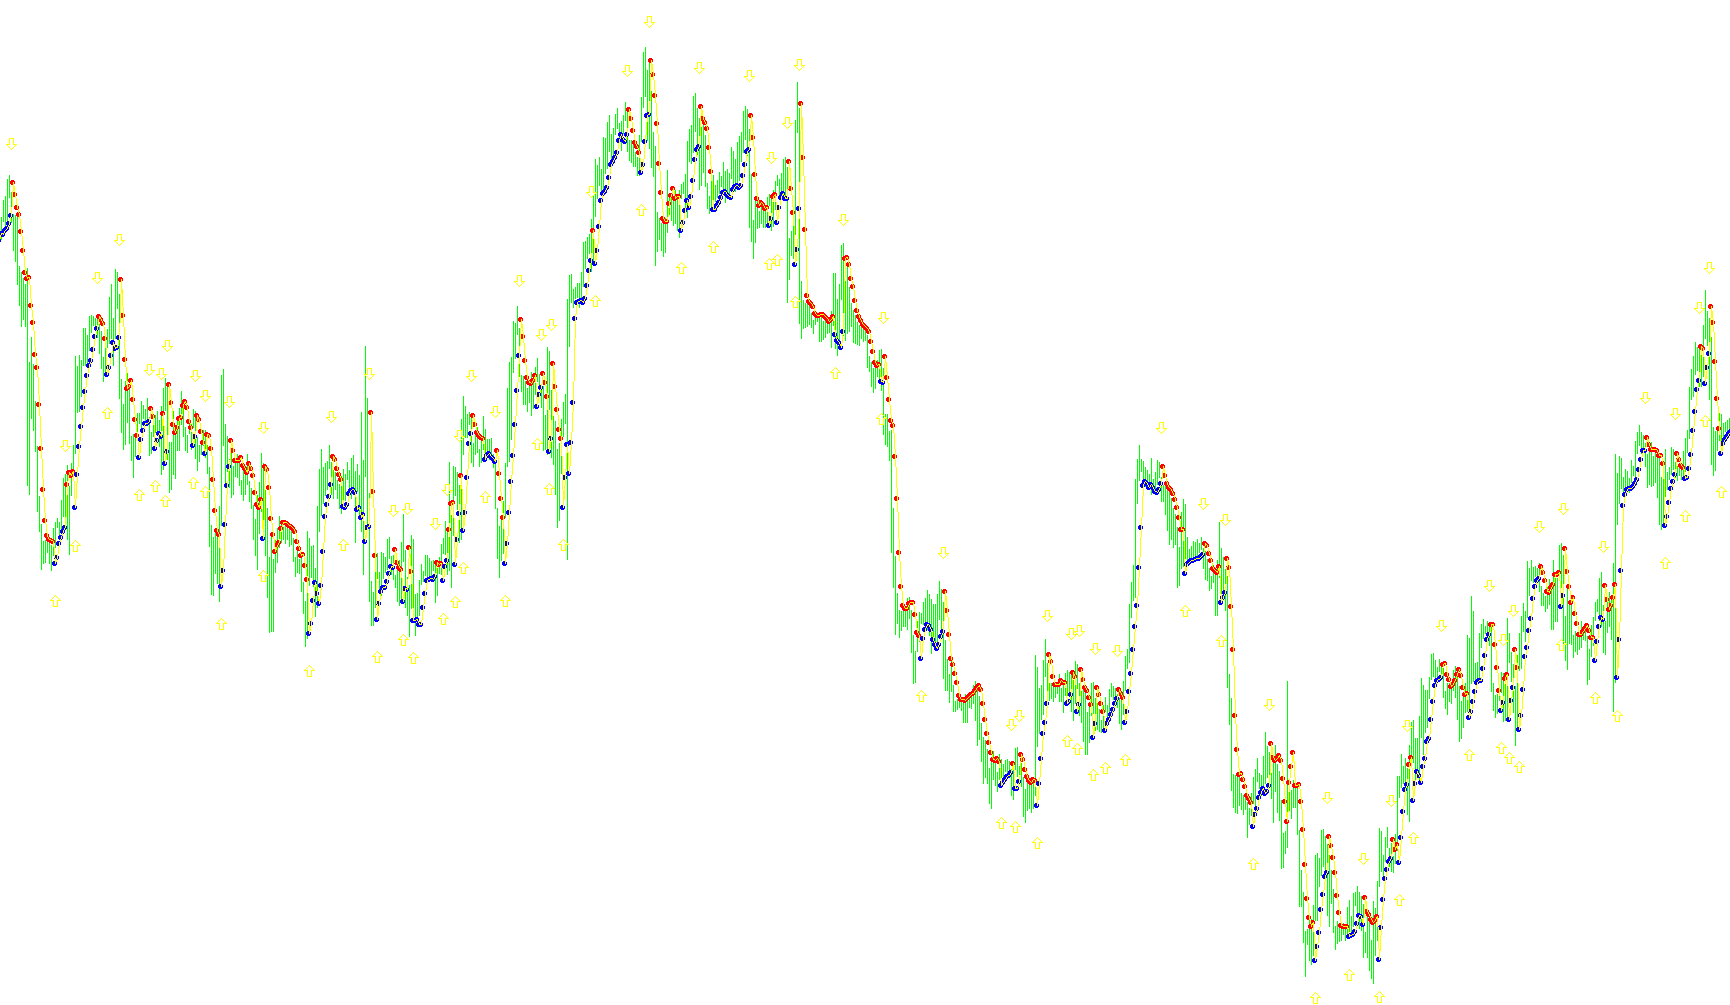
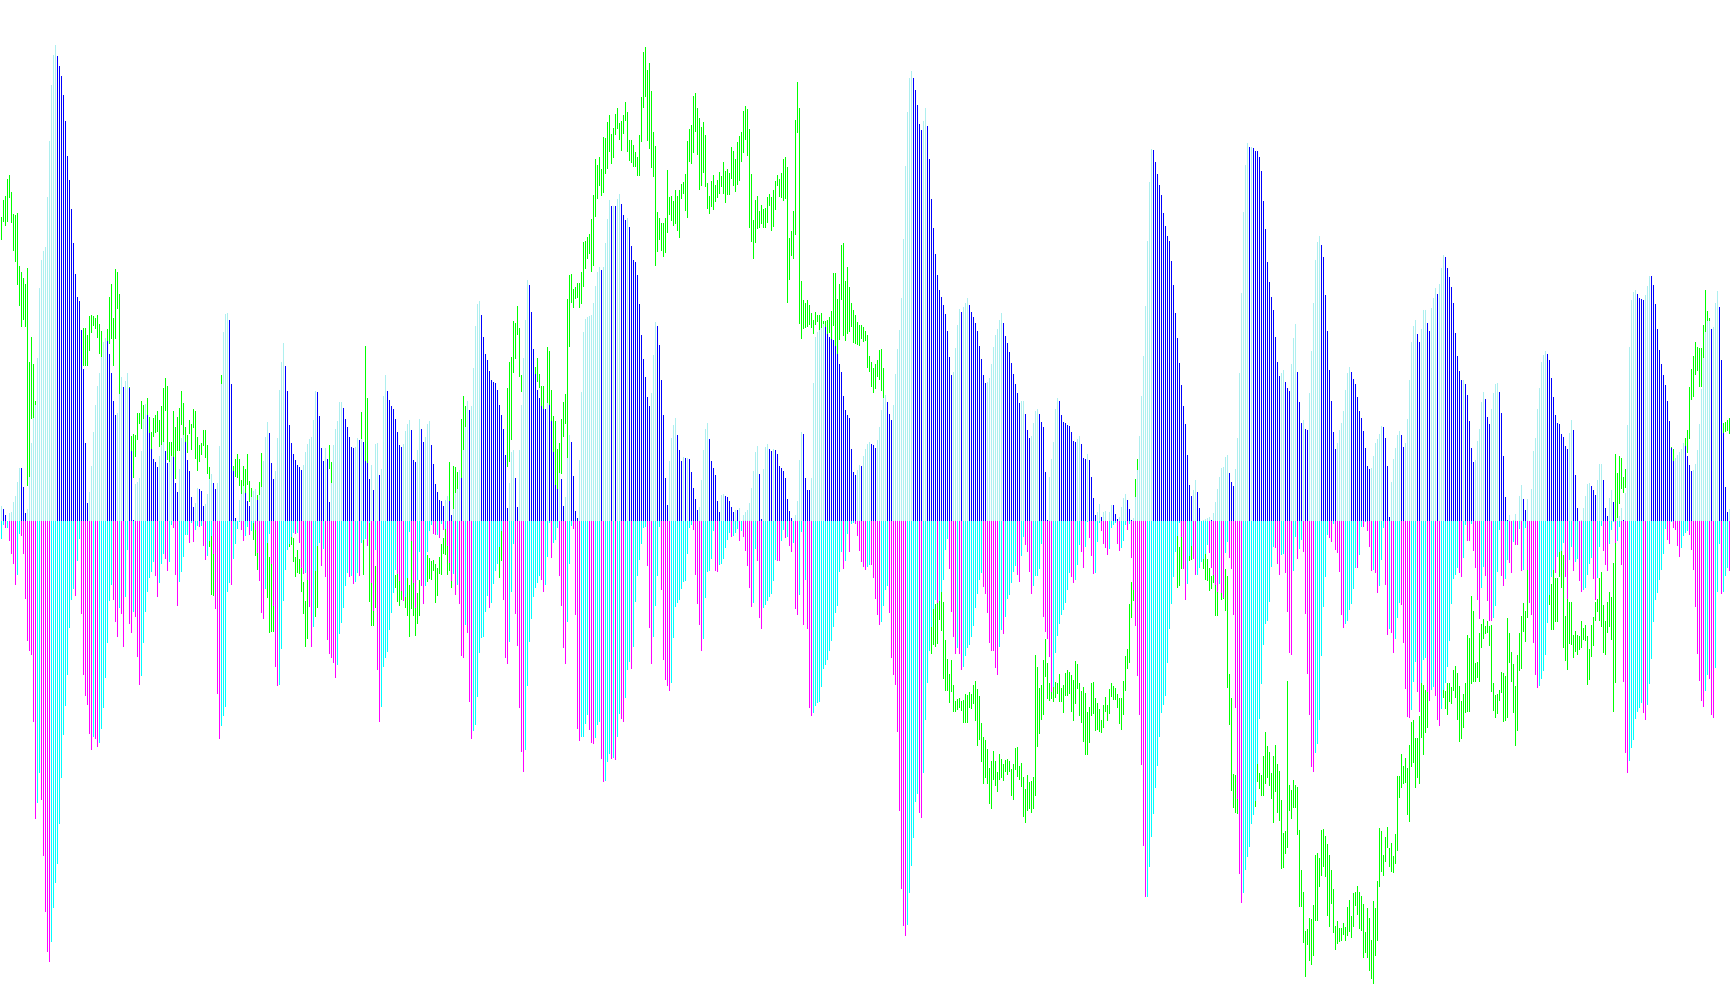
This indicator calculates a multi-layered exponential moving average of price volatility to identify trend reversals through the divergence between an Ergodic CCI signal and its smoothed trigger line.
FX_Sniper's_Ergodic_CCI_Trigger_(SRDC)
Indicator

FX_Sniper's_Ergodic_CCI_Trigger_(SRDC)

iMAOnArray

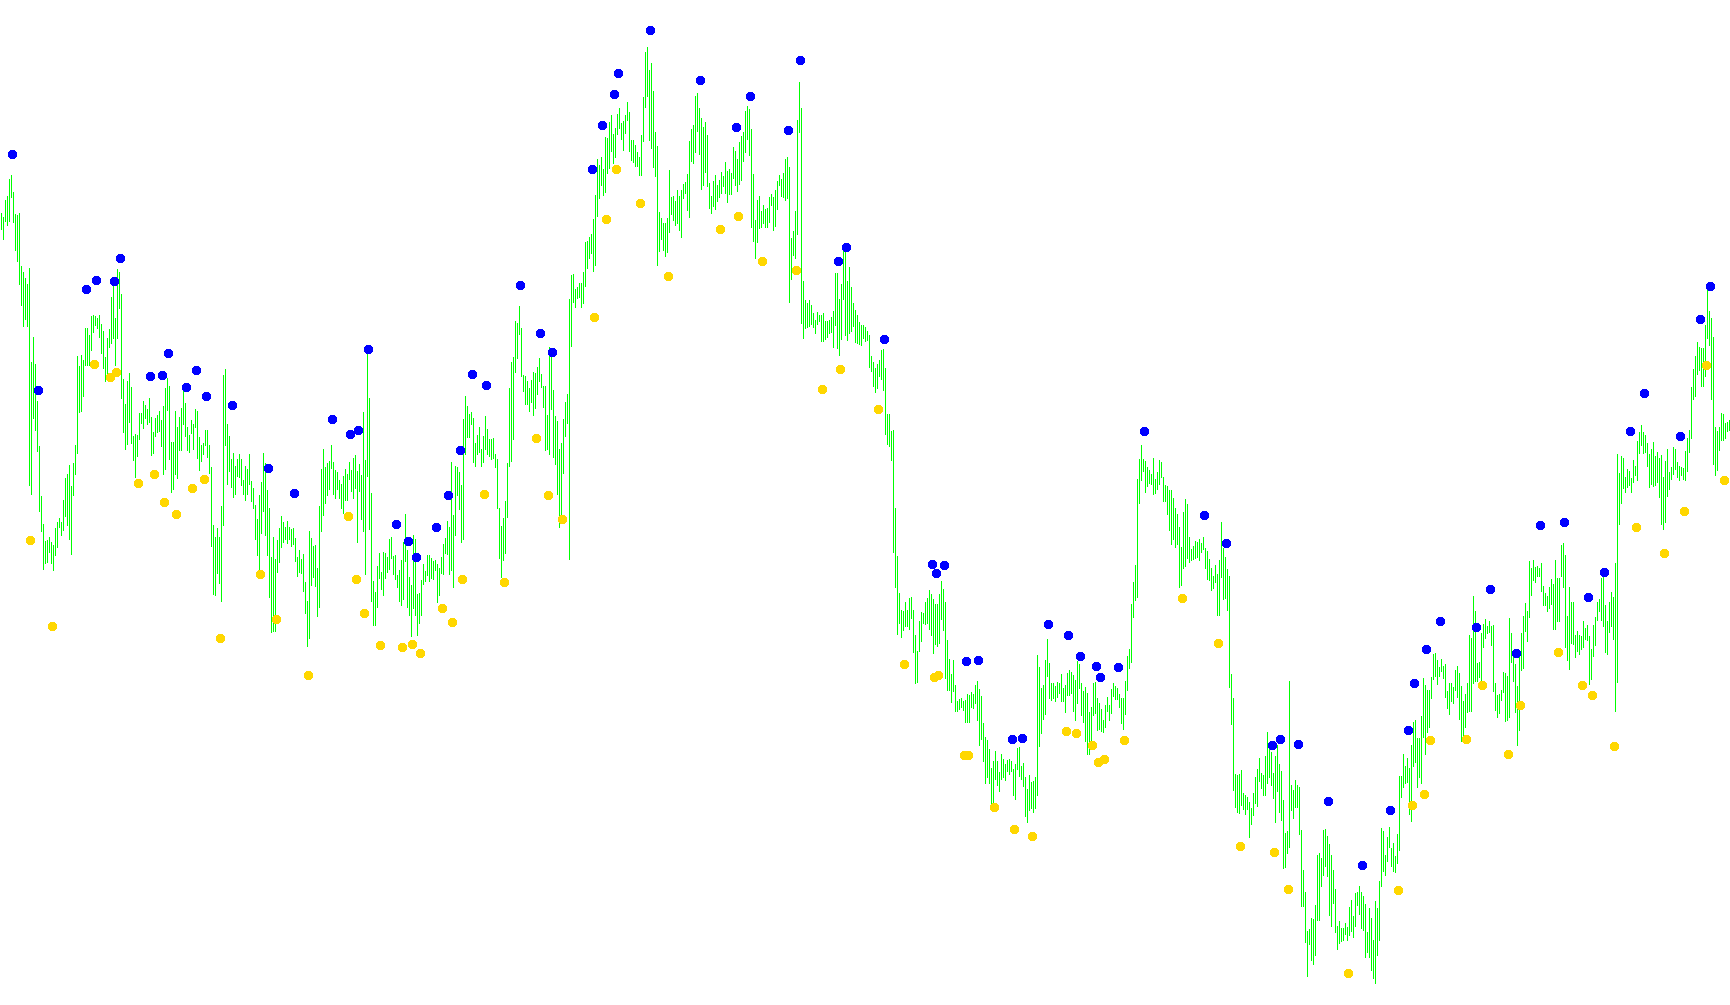
This indicator calculates a proprietary momentum ratio by smoothing absolute price changes and comparing nested Exponential Moving Averages to identify trend shifts.

FX_Sniper's_Ergodic_CCI_Trigger_001
Indicator

FX_Sniper's_Ergodic_CCI_Trigger_001

iMAOnArray

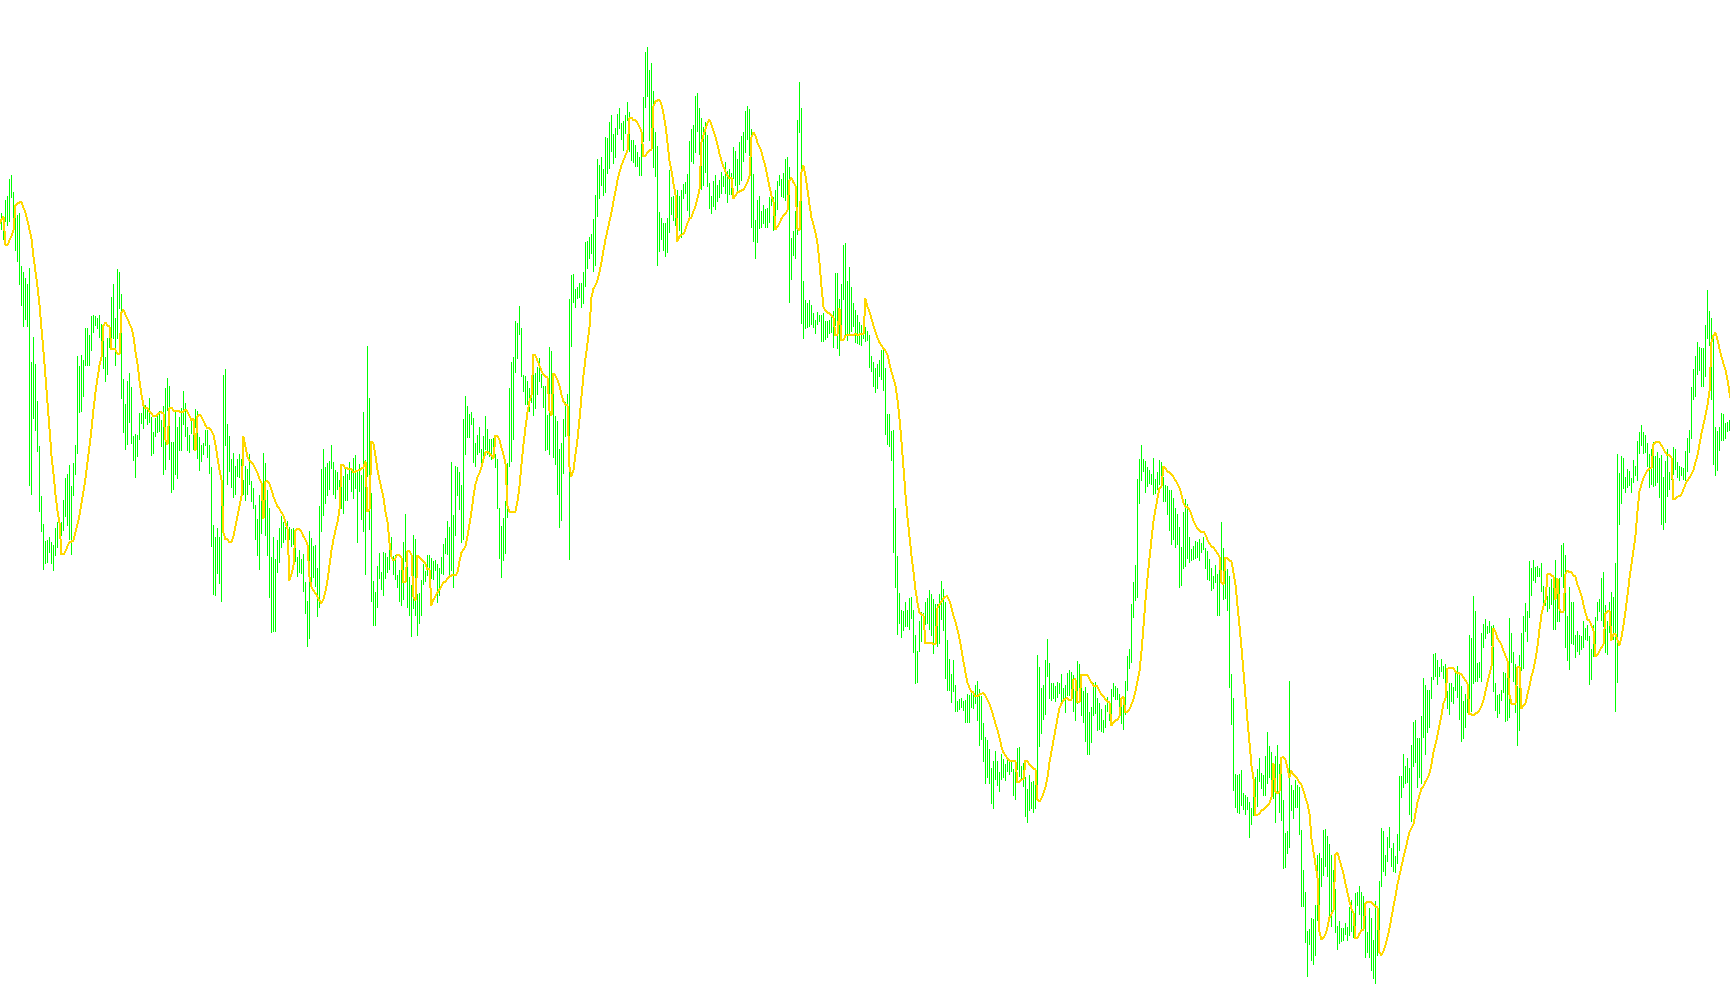
This indicator identifies trend shifts by calculating the ratio of smoothed directional momentum against smoothed absolute price movements to generate actionable long and short signals.

FX_Sniper's_Ergodic_CCI_Trigger_002
Indicator

FX_Sniper's_Ergodic_CCI_Trigger_002

iMAOnArray

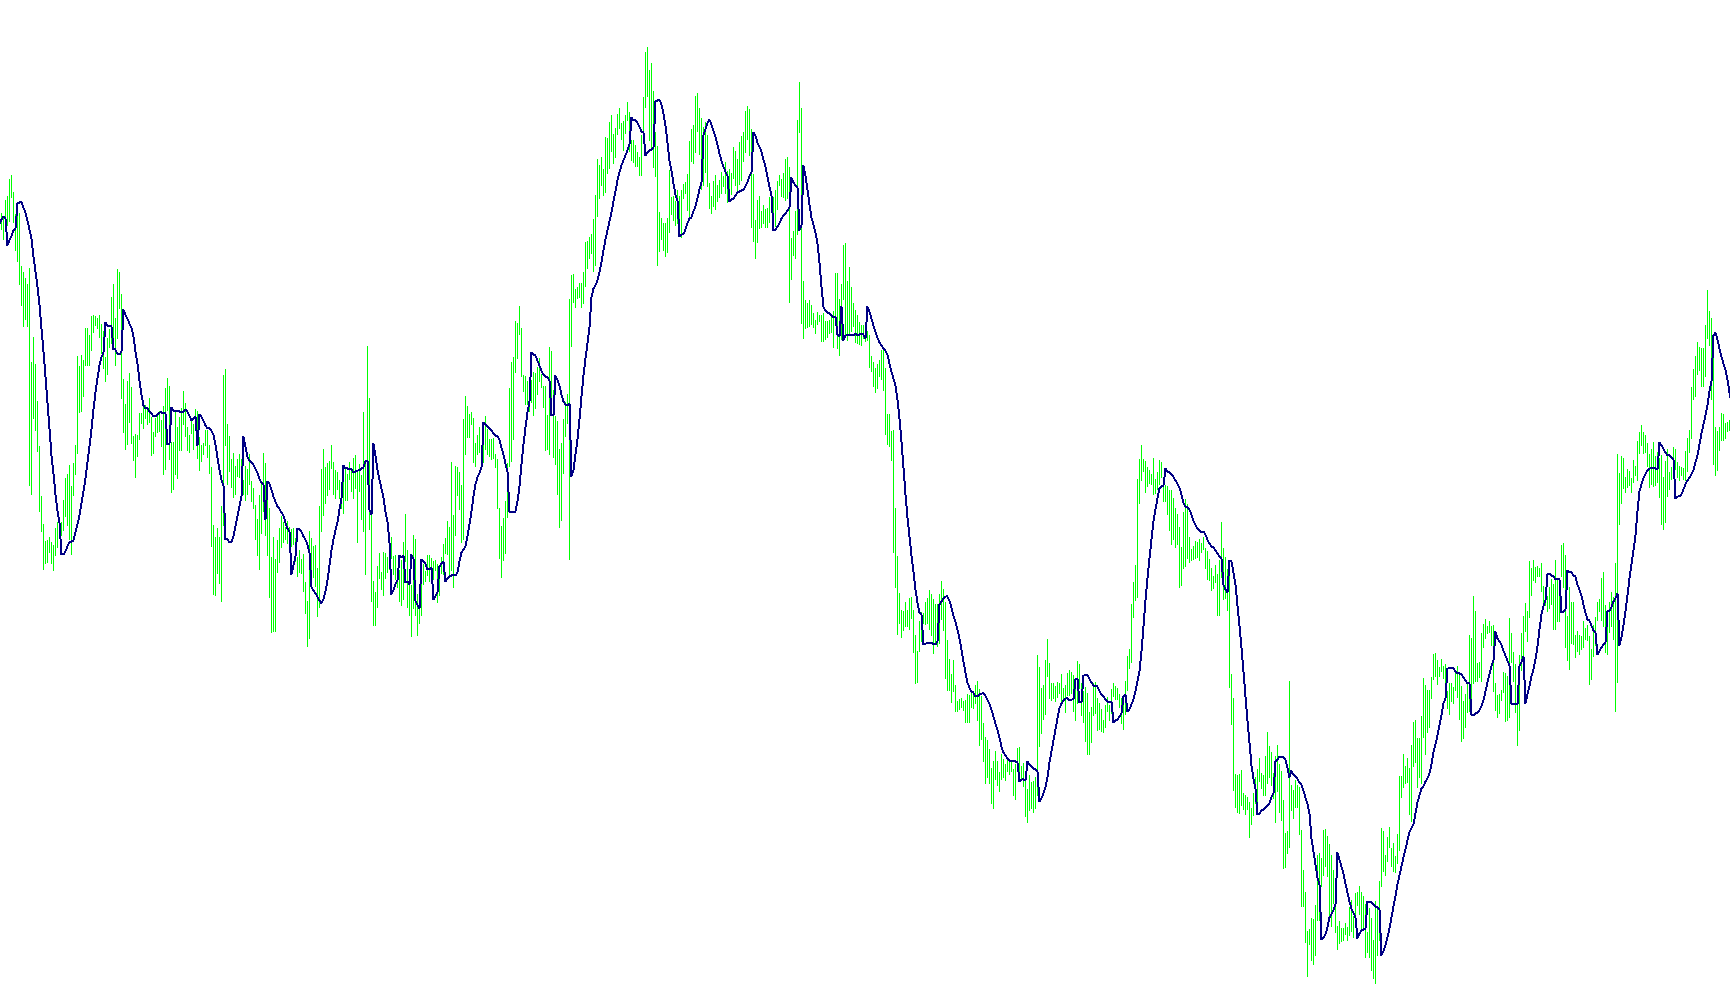
This indicator calculates a specialized Commodity Channel Index by processing the ratio of smoothed price velocity against its absolute magnitude to identify trend reversals.

FX_Sniper's_T3_CCI
Indicator

FX_Sniper's_T3_CCI

iCCI

This indicator applies a triple exponential smoothing algorithm to the Commodity Channel Index to filter noise and identify underlying trend momentum.

FX_Snipers_Ergodic_CCI_Trigger
Indicator

FX_Snipers_Ergodic_CCI_Trigger

iMAOnArray

The algorithm calculates a smoothed momentum ratio by dividing exponentially moving averages of price changes by their absolute values to identify trend divergences.

FX_Snipers_Ergodic_CCI_Trigger_Alert_Fast_
Indicator

FX_Snipers_Ergodic_CCI_Trigger_Alert_Fast_

This indicator utilizes nested exponential smoothing of price differentials to calculate an ergodic relative strength index, triggering signals based on the momentum crossover between the primary ergodic line and a smoothed trigger buffer.

FX_Snipers_Ergodic_CCI_Trigger_Signals
Indicator

FX_Snipers_Ergodic_CCI_Trigger_Signals

iATR

This indicator identifies trend reversals by detecting crossovers between the Ergodic CCI signal and its primary output, plotting directional arrows based on ATR-adjusted volatility thresholds.

FX_Sniper_s_Ergodic_CCI_Trigger_Alert
Indicator

FX_Sniper_s_Ergodic_CCI_Trigger_Alert

iMAOnArray

This indicator identifies trend reversals by calculating a ratio of exponential moving averages derived from price momentum and its absolute magnitude to generate divergent trigger signals.

Indicator

G#MACD

iMACD
Indicator

G#MACD_Bars

iMACD
GA-ind
Indicator

GA-ind

iMAiMAOnArray

Calculates the sum of two Exponential Moving Averages to derive a primary trend line, overlaid with a Simple Moving Average signal for momentum shifts.

GA-ind_2color
Indicator

GA-ind_2color

iMAiMAOnArray

This indicator calculates the sum of two Exponential Moving Averages and identifies bullish or bearish momentum by comparing that aggregate against a Simple Moving Average signal line.

Indicator

GainTicks2Allfxt_V2_1

Indicator

GainTicks2fxt

Gann Hi-lo Activator SSL
Indicator

Gann Hi-lo Activator SSL

iMA

The algorithm identifies trend direction by comparing current closing prices against smoothed high and low averages to plot a responsive structural boundary line.

Gann Hi-lo Activator SSL_001
Indicator

Gann Hi-lo Activator SSL_001

iMA

This indicator dynamically switches between high and low price moving averages based on a momentum-driven trend detection logic.

Gann HiLo Activator
Indicator

Gann HiLo Activator

iMA

This indicator identifies trend reversal points by detecting instances where price action breaches simple moving averages calculated from the high and low extremes.

Gann HiLo ActivatorV2
Indicator

Gann HiLo ActivatorV2

iMA

This indicator identifies price extremes by detecting breaches of high and low simple moving average envelopes to pinpoint structural reversal levels.

Gann HiLo ActivatorV2_Alert_Email
Indicator

Gann HiLo ActivatorV2_Alert_Email

iMA

This indicator identifies trend exhaustion by detecting price breaches of high/low SMA boundaries relative to a secondary moving average filter.

Gann HiLo ActivatorV2_Alert_Email_v1.1 todd
Indicator

Gann HiLo ActivatorV2_Alert_Email_v1.1 todd

iMA

This indicator identifies price momentum shifts by detecting breaches of high and low moving averages relative to a secondary smoothed trend filter.

Gann HiLo ActivatorV2_Alert_Email_v1.1
Indicator

Gann HiLo ActivatorV2_Alert_Email_v1.1

iMA

This indicator identifies trend shifts by detecting price crossovers between moving averages of high/low extremes and a primary closing price moving average.

Gann HiLo ActivatorV2_Alert_Email_v1.1_001
Indicator

Gann HiLo ActivatorV2_Alert_Email_v1.1_001

iMA

Identifies trend reversals by detecting when price action breaks through high and low moving average boundaries relative to a secondary trend filter.

Gann SQ9  Price Levels_version-3
Indicator

Gann SQ9 Price Levels_version-3

This indicator projects dynamic horizontal price levels by applying a mathematical square root transformation to user-defined pivot coordinates.

Gann SQ9  Price Levels_version-4
Indicator

Gann SQ9 Price Levels_version-4

This indicator dynamically projects a series of horizontal price levels based on square root mathematical transformations derived from specific user-defined anchor points.

Gann's_Cycle_Levels
Indicator

Gann's_Cycle_Levels

This tool projects a series of horizontal price levels based on the geometric division of the distance between two user-defined anchors at 30, 45, and 90-degree intervals.

Indicator

Gann-ICWR v0.1.1 beta5

iRSI
Indicator

Gann-ICWR v01 with time

iRSI
Indicator

Gann-ICWR-fixed

iRSI
Indicator

Gann-ICWR

iRSI
Indicator

Gann

Gann2
Indicator

Gann2

This indicator projects multiple price trend lines and horizontal levels based on historical lunar cycle cycles and calculated Gann step increments.

GannSwingsVIII
Indicator

GannSwingsVIII

This indicator identifies structural trend reversals by tracking sequential swing highs and lows to map out price momentum transitions.

GannSwingsVIII_v1
Indicator

GannSwingsVIII_v1

This indicator identifies market structural shifts by tracking swing highs and lows to detect trend reversals and continuous momentum based on specific price peak counts.

GannSwingsXV
Indicator

GannSwingsXV

This indicator identifies multi-level structural pivots and trend reversals by filtering out noise using an 'out-side' bar logic that detects price expansion beyond existing swing extremes.

GannSwingsXVI
Indicator

GannSwingsXVI

This indicator identifies structural market pivots and trend reversals by filtering price action through multi-layered swing point verification and breakout detection logic.

GannSwingsXVI_v1
Indicator

GannSwingsXVI_v1

This indicator identifies multi-layered price structure by tracking hierarchical swing points and filtering out overlapping range bars to reveal core trend pivots.

GannSwingsXV_v1
Indicator

GannSwingsXV_v1

This indicator identifies market structural shifts and price extremes by dynamically evolving swing high and low points based on bar expansion and trend polarity.

GannZigZag
Indicator

GannZigZag

This indicator identifies significant structural trend reversals by monitoring the equilibrium of consecutive price highs and lows relative to a user-defined range.

GannZigZag_001
Indicator

GannZigZag_001

This indicator identifies structural trend shifts by tracking consecutive high and low price pivots to plot significant volatility turning points.

GannZigZag_002
Indicator

GannZigZag_002

This indicator identifies structural price pivots by tracking consecutive high and low breaches to determine trend reversals and significant support/resistance levels.

GannZigZag_v1
Indicator

GannZigZag_v1

This indicator identifies structural market pivots by monitoring relative price extremes and tracking consecutive highs or lows to detect trend reversals.

GannZigZag_v2
Indicator

GannZigZag_v2

This indicator identifies structural trend shifts by tracking consecutive price extremes and capturing local highs or lows based on balanced volatility thresholds.

Indicator

Gann_001

Gann_002
Indicator

Gann_002

This indicator maps geometric price levels by identifying lunar cycle high and low boundaries and projecting a multi-layered grid of Gann-based trend lines and horizontal support zones.

GANN_rvm_v4
Indicator

GANN_rvm_v4

This indicator calculates dynamic equilibrium levels and volatility bounds by synthesizing high, low, and close price actions across synchronized higher timeframe data points.

GANN_ugli_urovni
Indicator

GANN_ugli_urovni

This indicator projects geometric price levels and trend angles based on the square root of the price to identify potential harmonic pivot zones.

Gann_v1
Indicator

Gann_v1

iMA

The indicator identifies potential trend reversals by monitoring price breaches of moving average bounds calculated from high and low price extremes.

Gartley Reversal Auto
Indicator

Gartley Reversal Auto

This indicator identifies harmonic price patterns by calculating specific retracement levels and potential reversal targets based on the ZigZag trend geometry.

gator
Indicator

gator

iMA

This indicator quantifies market volatility and trend direction by calculating the absolute differential between three nested moving averages with varying periods and shifts.