DEMA_RLH
Download script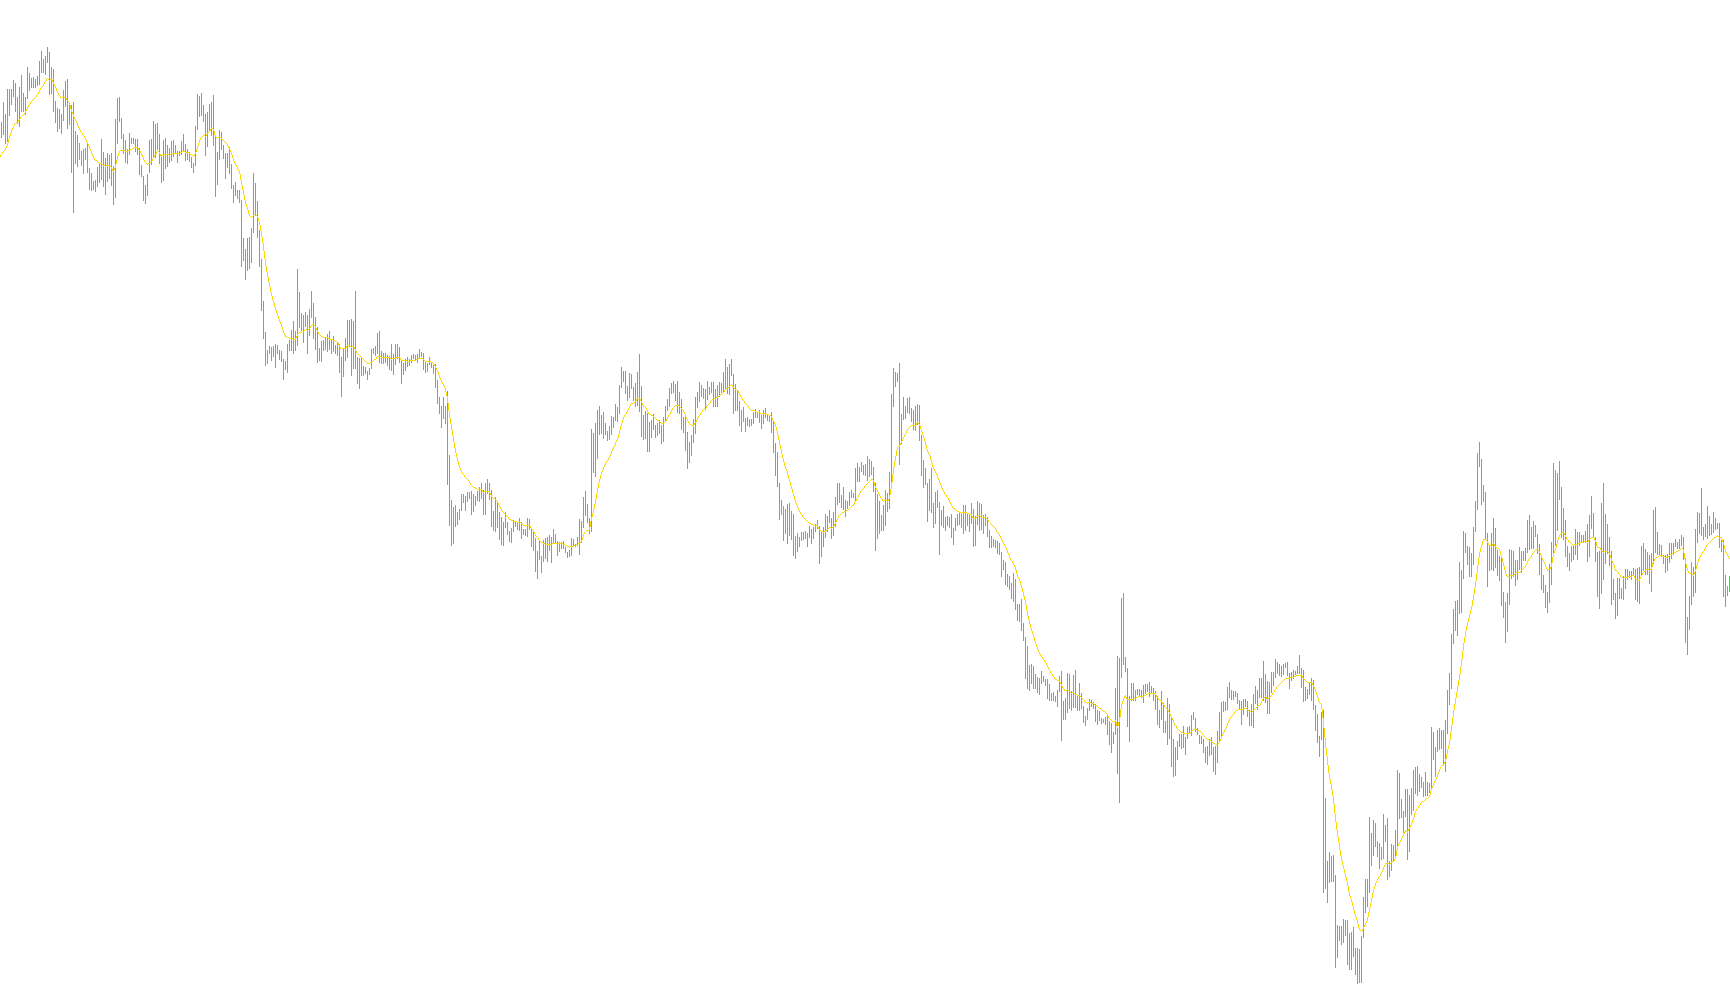
The DEMA_RLH indicator is a sophisticated technical analysis tool designed to track price trends with high precision. Its primary purpose is to provide a smoother, more responsive visualization of market momentum compared to standard moving averages, which often suffer from "lag"—the delay between a price change and the indicator's reaction.
Core Logic and Methodology
The script operates by performing a multi-layered calculation to strip away market noise while maintaining a close connection to real-time price action. It achieves this through a three-step mathematical process:
- The Primary Average: The tool first calculates a standard Exponential Moving Average (EMA). This serves as the baseline, smoothing out erratic price fluctuations to show the general direction of the market.
- The Secondary Smoothing: It then performs a second calculation by taking the average of that first average. By calculating an "Average of an Average," the tool identifies the broader underlying trend.
- The DEMA Calculation: Finally, the script applies a specific formula—multiplying the primary average by two and subtracting the secondary average. This mathematical interaction creates the Double Exponential Moving Average (DEMA).
Visual Representation
To help traders interpret these complex calculations quickly, the indicator displays three distinct lines on the chart, each color-coded to represent a different layer of data:
- Red Line: Represents the standard Exponential Moving Average. It shows the initial smoothing of price data.
- Green Line: Represents the "Average of the Average." This is a deeper, slower trend line that filters out more market noise.
- Yellow Line (DEMA): This is the primary signal line produced by the final calculation. Because it combines both the fast and slow components described above, it is designed to follow the price much more closely than a standard average while remaining smooth enough to be reliable for trend identification.
Practical Application
By using this logic, the indicator helps traders see "where the price is going" with less of the distortion caused by temporary spikes or dips. It acts as a refined tracking system that balances responsiveness (speed) with stability (smoothness), making it an effective tool for identifying trend reversals and sustained market directions.
//+------------------------------------------------------------------+
//|                                                   DEMA_RLH       |
//|                                    Copyright © 2006, Robert Hill |
//|                                       http://www.metaquotes.net/ |
//|                                                                  |
//| Based on the formula developed by Patrick Mulloy                 |
//|                                                                  |
//| It can be used in place of EMA or to smooth other indicators.    |
//|                                                                  |
//| DEMA = 2 * EMA - EMA of EMA                                      |
//|                                                                  |
//|  Red is EMA, Green is EMA of EMA, Yellow is DEMA                 |
//|                                                                  |
//+------------------------------------------------------------------+
#property  copyright "Copyright © 2006, Robert Hill "
#property  link      "http://www.metaquotes.net/"

//---- indicator settings
#property  indicator_chart_window
#property  indicator_buffers 3
#property  indicator_color1  Red
#property  indicator_color2  Green
#property  indicator_color3  Yellow
#property  indicator_width1  2
#property  indicator_width2  2
#property  indicator_width3  2

extern int EMA_Period = 14;

//---- buffers
double Dema[];
double Ema[];
double EmaOfEma[];


//+------------------------------------------------------------------+
//| Custom indicator initialization function                         |
//+------------------------------------------------------------------+
int init()
  {

//---- drawing settings

   SetIndexStyle(0,DRAW_LINE);
   SetIndexStyle(1,DRAW_LINE);
   SetIndexStyle(2,DRAW_LINE);
   SetIndexDrawBegin(0,EMA_Period);
   IndicatorDigits(MarketInfo(Symbol(),MODE_DIGITS)+2);

//---- 3 indicator buffers mapping
   if(!SetIndexBuffer(0,Ema) &&
      !SetIndexBuffer(1,EmaOfEma) &&
      !SetIndexBuffer(2,Dema))
      Print("cannot set indicator buffers!");
//---- name for DataWindow and indicator subwindow label
   IndicatorShortName("DEMA("+EMA_Period+")");
//---- initialization done
   return(0);
  }

int start()
{
   int i, limit;
   int    counted_bars=IndicatorCounted();
   if(counted_bars>0) counted_bars--;
   limit=Bars-counted_bars;


   for(i = limit; i >= 0; i--)
       Ema[i] = iMA(NULL,0,EMA_Period,0,MODE_EMA,PRICE_CLOSE,i);
   for(i = limit; i >=0; i--)
       EmaOfEma[i] = iMAOnArray(Ema,Bars,EMA_Period,0,MODE_EMA,i);


//========== COLOR CODING ===========================================

   for(i = limit; i >=0; i--)
       Dema[i] = 2 * Ema[i] - EmaOfEma[i];

      return(0);
  }
//+------------------------------------------------------------------+
Comments