dex_HeLMA_v2.0
Download script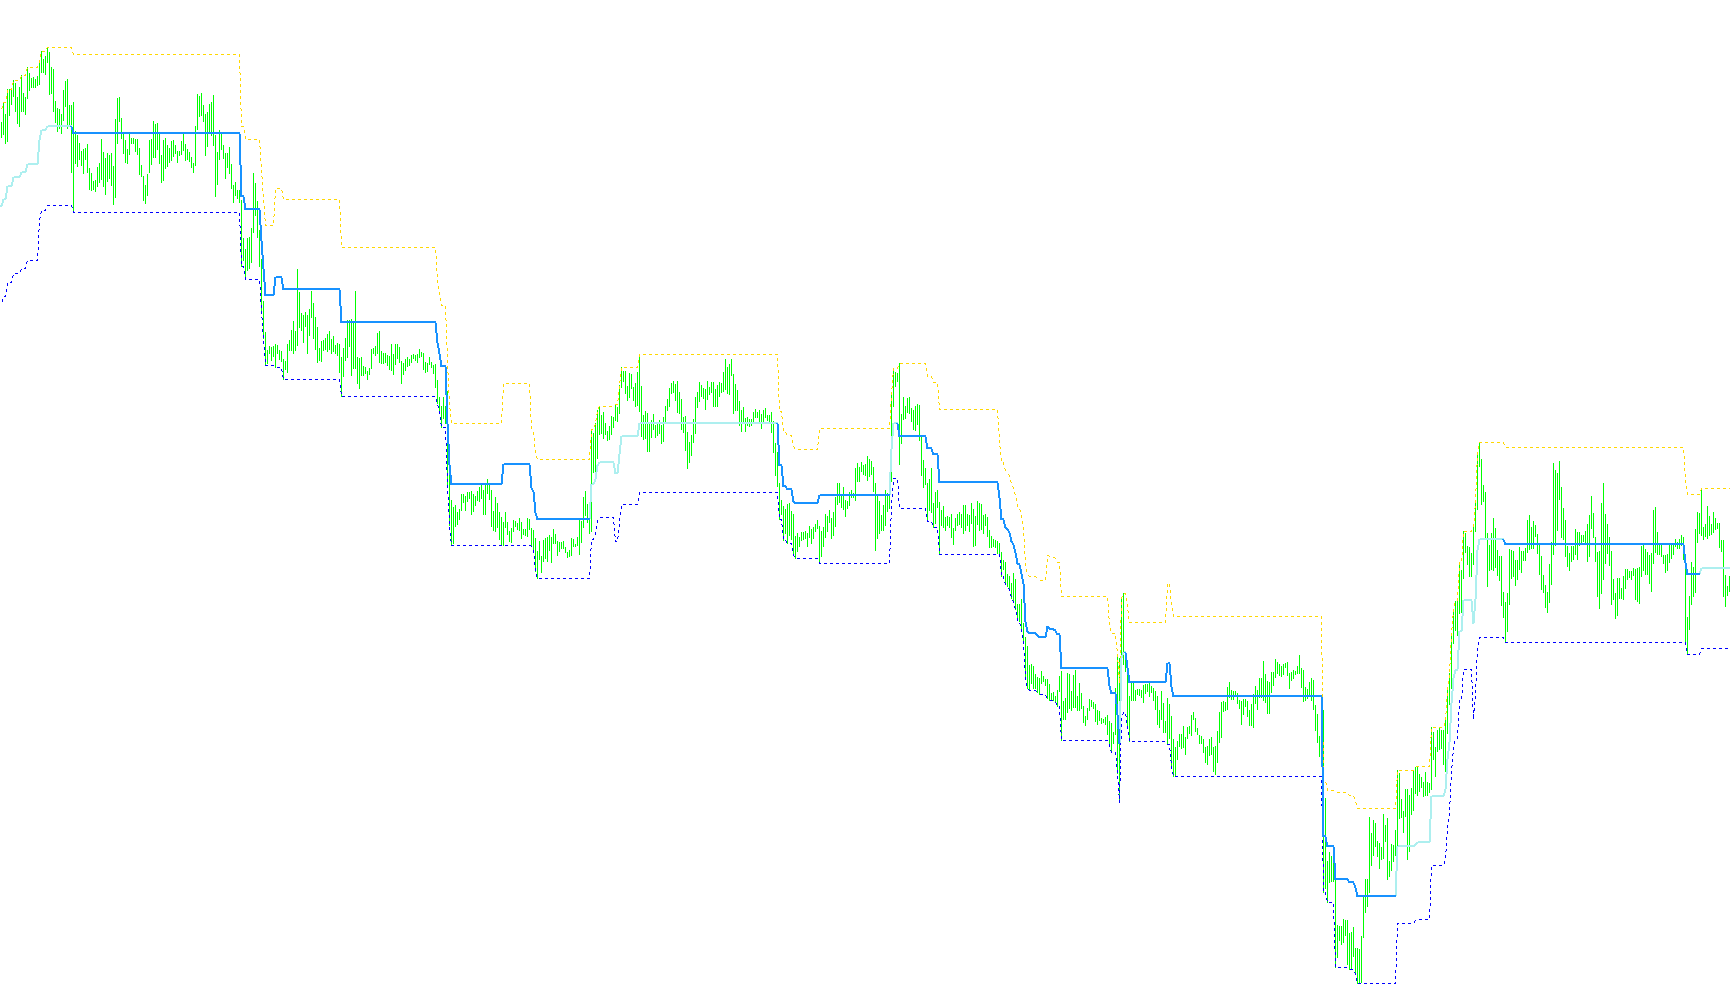
The dex_HeLMA v2 script is a technical analysis tool designed to identify market trends and provide visual price guidance on a trading chart. It functions by analyzing historical price volatility and applying specific mathematical filters to determine the current momentum of the market.
Core Logic Breakdown
1. Volatility Analysis (Dynamic Range Calculation) The script begins by calculating the "average channel width" of the market. To do this, it looks back at several days of historical data to measure the distance between highs and lows across various timeframes (specifically focusing on 1, 5, 10, and 20-day cycles). By averaging these ranges, the script establishes a "dynamic range" or a standard volatility unit. This helps the tool understand how much price movement is considered "normal" for the current market environment.
2. Channel Construction Using the dynamic range calculated above, the script builds a corridor around the current price. It tracks two primary boundaries:
- Upper and Lower Boundaries: These are adjusted based on price action. If the price exceeds the previous high or falls below the previous low by more than the established volatility unit, the script "redraws" these boundaries to account for the new price territory.
- The Mid-Line (Signal Line): The script maintains a center point between these two boundaries, which serves as the primary basis for trend identification.
3. Trend Direction Filtering To prevent "noise" (minor fluctuations that might give false signals), the script employs a dual-layer confirmation system:
- Price Movement: It checks if the Mid-Line is moving upward or downward compared to its previous position.
- Moving Average Confirmation: It cross-references the price movement with an Exponential Moving Average (EMA). This ensures that the trend is not just a momentary spike but part of a sustained move in the correct direction.
4. Visual Output The final output on your chart consists of specific colored signals:
- Trend Tracking: When both the price mid-line and the moving average align in an upward direction, the script marks this as an "Up" trend.
- Opposition Tracking: When they align downward, it marks a "Down" trend.
- Visual Markers: The script handles these trends by highlighting specific buffers on the chart (Aqua and Red), providing a clear visual distinction between bullish and bearish momentum.
Summary for the User
In simple terms, this tool looks at how much the market typically moves over several days to create a "safety corridor." It then watches the middle of that corridor; if that middle line moves in the same direction as a smoothed average of the price, it signals a trend. This helps traders see the "big picture" by filtering out small price wiggles and focusing on the actual flow of the market.
//+------------------------------------------------------------------+
//|                                                 dex_HeLMA v2.mq4 |
//|                                         Copyright © 2007, akadex |
//+------------------------------------------------------------------+

#property copyright "Copyright © 2007, akadex"
#property link      "Shambala"

#property indicator_chart_window
#property indicator_buffers 4
#property indicator_color1 Gray
#property indicator_color2 Gray
#property indicator_color3 Aqua
#property indicator_color4 Red

extern string a="Ñòåïåíü ôèëüòðàöèè";
extern int FiltrPeriod=6;

int fs,ai,bi,k,Points;
double zz[],ha[],la[],sa[],DIR[],UpBuffer[],DnBuffer[];
double P,R1,R5,R10,R20,RAvg,currday,di,hm,lm;

int init()
{

   IndicatorBuffers(6);

   SetIndexBuffer(0,ha);
   SetIndexStyle (0,0,2,1);
   SetIndexBuffer(1,la);
   SetIndexStyle (1,0,2,1);
   SetIndexBuffer(2,UpBuffer);
   SetIndexStyle (2,0,0,2);
   SetIndexBuffer(3,DnBuffer);
   SetIndexStyle (3,0,0,2);
   SetIndexBuffer(4,sa);
   SetIndexBuffer(5,DIR);

   return(0);
}

int start()
{

   int i,n;
   int counted_bars=IndicatorCounted();
   if (counted_bars<0) {Print("Indicator Error (Counted bars < 0)!" ); return(-1); }
   if (Bars<100) {Print("Indicator Error (Bars < 100)!" ); return(-1); }
   int cbi=Bars-2;
   if (counted_bars>2) {cbi=Bars-counted_bars-1; }

   for (i=cbi; i>=0; i--)
   {
  	currday=i*Period()/PERIOD_D1;
   R1 =  (iHigh(NULL,PERIOD_D1,currday+1)-iLow(NULL,PERIOD_D1,currday+1))/Point;
   for(k=1;k<=5;k++)    R5    =  R5  +  (iHigh(NULL,PERIOD_D1,currday+k)-iLow(NULL,PERIOD_D1,currday+k))/Point;
   for(k=1;k<=10;k++)   R10   =  R10 +  (iHigh(NULL,PERIOD_D1,currday+k)-iLow(NULL,PERIOD_D1,currday+k))/Point;
   for(k=1;k<=20;k++)   R20   =  R20 +  (iHigh(NULL,PERIOD_D1,currday+k)-iLow(NULL,PERIOD_D1,currday+k))/Point;

   R5    = R5/5;
   R10   = R10/10;
   R20   = R20/20;
   Points  =  NormalizeDouble((R5+R10+R20+R1)/4,0);
   if (Points!=0) di=Points*Point;

   Comment("\nØèðèíà êàíàëà òðåíäà: "+Points+" ïóíêòîâ.");

   if (i>Bars-1) {hm=High[i]; lm=hm-di; ai=i; bi=i+1; fs=0;}
   if (High[i]-Low[i]>=di)
      {
   if ((High[i]+Low[i])/2>=(ha[i+1]+la[i+1])/2)
      {
       hm=High[i]; lm=hm-di; ai=i; fs=1;
       }
       else
       {
       lm=Low[i]; hm=lm+di; bi=i; fs=2;
       }
      }
       else
      if (High[i]>hm)
      {
      hm=High[i]; lm=hm-di; ai=i; fs=1;
      }
      else
      if (Low[i]<lm)
      {
      lm=Low[i]; hm=lm+di; bi=i; fs=2;
      }
      ha[i]=hm;
      la[i]=lm;
      sa[i]=(ha[i]+la[i])/2;
      if (i==0)
      {
      if (ai!=0 || bi!=0)
      {
      for (n=0; n<=ai+1; n++) if (ha[n]>ha[n+1]) {ai=n; break;}
      for (n=0; n<=bi+1; n++) if (la[n]<la[n+1]) {bi=n; break;}
      }
      }
      }

   for (i=cbi; i>=0; i--)
   {
   DIR[i] = DIR[i + 1];
   if (sa[i] - sa[i + 1] > 0 && (iMA(NULL,0,FiltrPeriod,0,MODE_EMA,PRICE_CLOSE,i) > iMA(NULL,0,FiltrPeriod,0,MODE_EMA,PRICE_CLOSE,i+1))) DIR[i] = 1;
   if (sa[i + 1] - sa[i] > 0 && (iMA(NULL,0,FiltrPeriod,0,MODE_EMA,PRICE_CLOSE,i) < iMA(NULL,0,FiltrPeriod,0,MODE_EMA,PRICE_CLOSE,i+1))) DIR[i] = -1;

      if (DIR[i] > 0)
         {
         UpBuffer[i] = sa[i];
         if (DIR[i + 1] < 0) UpBuffer[i + 1] = sa[i + 1];
         DnBuffer[i] = EMPTY_VALUE;
         }
         else
         {
     if (DIR[i] < 0)
         {
         DnBuffer[i] = sa[i];
         if (DIR[i + 1] > 0) DnBuffer[i + 1] = sa[i + 1];
         UpBuffer[i] = EMPTY_VALUE;
         }
         }
   }
   return(0);
}
Comments