DeMark Projected High & Low Script
Download script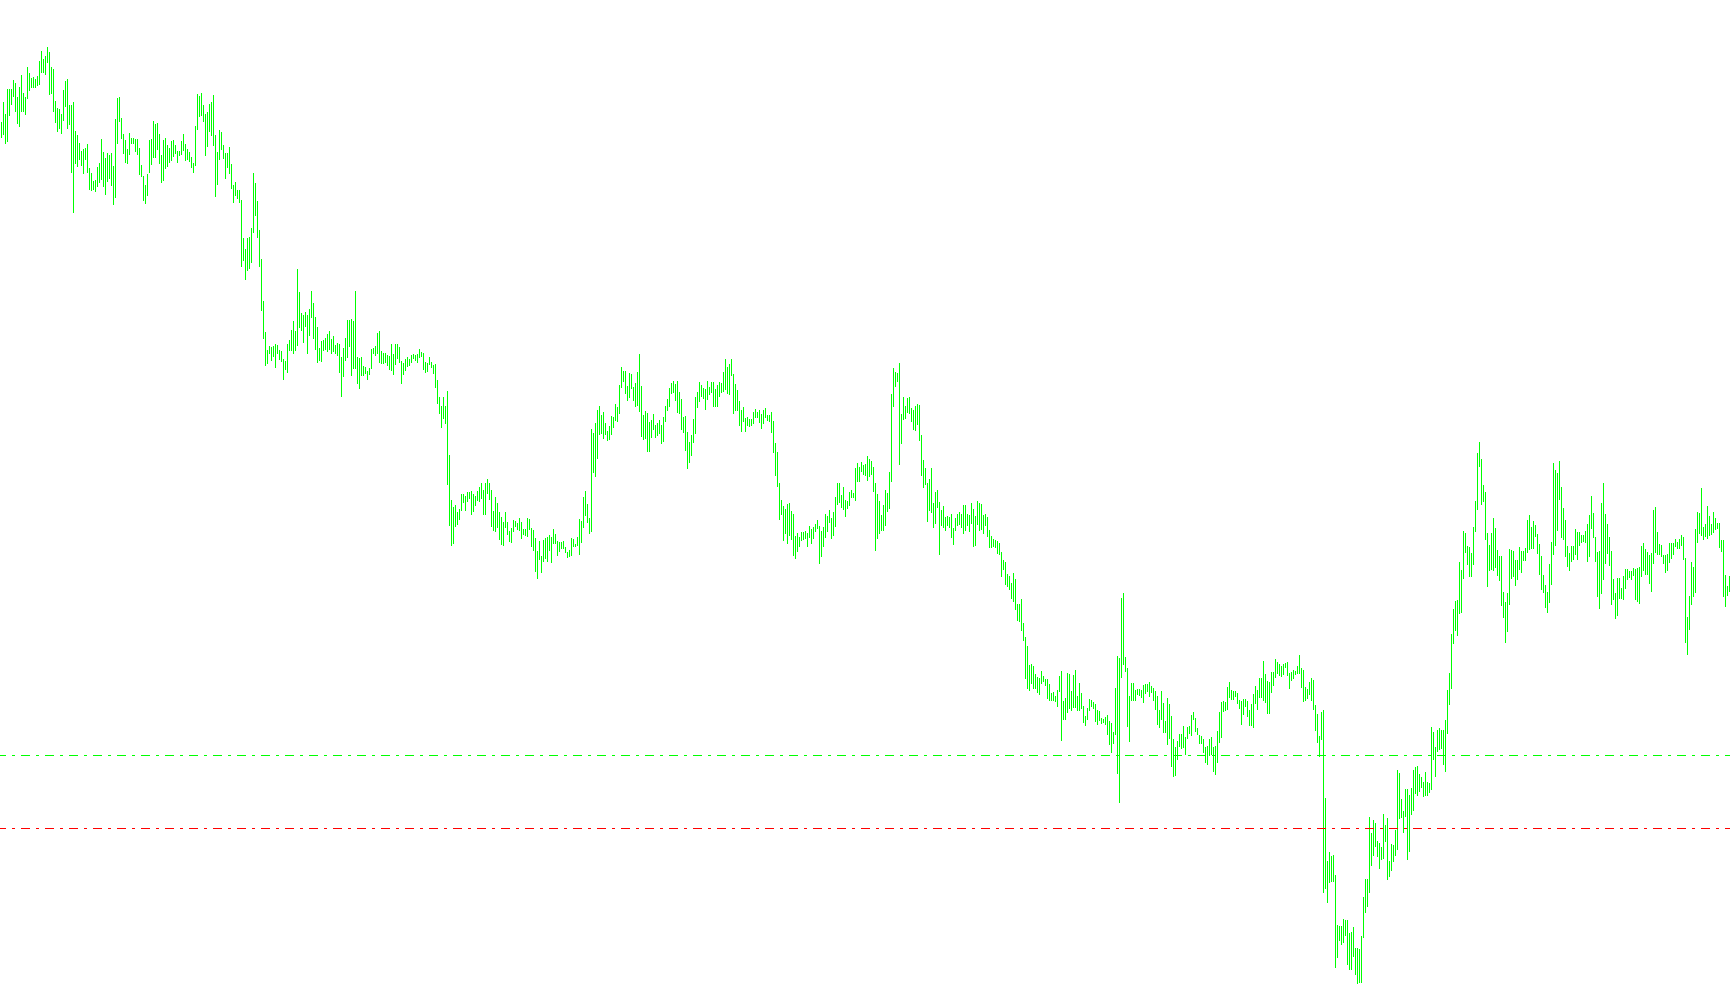
This script is designed to automate the calculation and visualization of DeMark Projected High and Low levels on your trading chart. It simplifies a complex mathematical formula used by many traders to identify potential reversal zones or price boundaries for the current trading day.
How the Logic Works
1. Data Collection The script begins by automatically gathering historical price data from the previous completed trading day. Specifically, it looks for four key pieces of information:
- The opening and closing prices of yesterday.
- The highest and lowest points reached during yesterday's session.
2. Smart Calculations (The DeMark Formula) Once the data is collected, the script applies a specific logical check to determine how to calculate today's projected levels. The math changes based on how yesterday’s price action behaved:
- Bearish Action: If yesterday closed lower than it opened, the formula weights the "Low" price more heavily.
- Bullish Action: If yesterday closed higher than it opened, the formula weights the "High" price more heavily.
- Neutral Action: If there was no change between the open and close, it balances the weight between the high and low prices equally.
By applying these different formulas based on market sentiment, the script calculates two specific values: the Projected High (DR) and the Projected Low (DS) for the current day.
3. Visual Representation After performing the math, the script automatically updates your chart so you don't have to do any manual drawing. It performs the following actions:
- Draws Horizontal Lines: It places a red dashed line at the projected low and a lime-colored dashed line at the projected high.
- Adds Text Labels: It places clear labels on the chart (e.g., "DeMark Projected Low") so you can easily identify what each line represents.
- Dynamic Updating: If these lines already exist on your chart, the script simply moves them to the new correct price positions; if they don't exist, it creates them automatically.
Important Usage Note
To ensure the calculations are accurate, the script includes a built-in safety check. It requires the chart to be set to a timeframe of one day or less (e.g., 15-minute, 1-hour, or 4-hour charts). If you try to run it on a weekly or monthly chart, the script will notify you that the period is too large and will not execute the calculation.
//+------------------------------------------------------------------+
//| Demark Projected High & Low Script.mq4 |
//| Converted to MT4 / MQ4 by Flash52 |
//| fxflash52@y... |
//+------------------------------------------------------------------+
#property copyright "Converted to MT4 / MQ4 by Flash52"
#property link "fxflash52@y..."

//+------------------------------------------------------------------+
//| Demark Projected High & Low script program start function |
//+------------------------------------------------------------------+

int start()
{
//---- initialize local variables

double day_high=1;
double day_low=1;
double yesterday_high=1;
double yesterday_open=1;
double yesterday_low=1;
double yesterday_close=1;
double today_open=1;
double dr=0;
double ds=0;
double x=0;
double rates_d1[2][6];

//---- exit if period is greater than daily charts
if(Period() > 1440)
{
Print("Error - Chart period is greater than 1 day.");
return(-1); // then exit
}

//---- Get new daily prices & calculate pivots

ArrayCopyRates(rates_d1, Symbol(), PERIOD_D1);

yesterday_close = rates_d1[1][4];
yesterday_open = rates_d1[1][1];
today_open = rates_d1[0][1];
yesterday_high = rates_d1[1][3];
yesterday_low = rates_d1[1][2];


//---- Calculate DeMark pivots

if(yesterday_close < yesterday_open)
{
x = (yesterday_high + (2* yesterday_low) + yesterday_close);
}
if(yesterday_close > yesterday_open)
{
x = ((yesterday_high*2) + yesterday_low + yesterday_close);
}
if(yesterday_close == yesterday_open)
{
x = (yesterday_high + yesterday_low + (2* yesterday_close));
}

dr = (x/2 - yesterday_low); //projected high
ds = (x/2 - yesterday_high); //projected low

//---- Set line labels on chart window

if(ObjectFind("DS Label") != 0)
{
ObjectCreate("DS Label", OBJ_TEXT, 0, Time[50], ds);
ObjectSetText("DS Label", "DeMark Projected Low", 8, "Arial", White);
}
else
{
ObjectMove("DS Label", 0, Time[50], ds);
}

if(ObjectFind("DR Label") != 0)
{
ObjectCreate("DR Label", OBJ_TEXT, 0, Time[50], dr);
ObjectSetText("DR Label", "DeMark Projected High", 8, "Arial", White);
}
else
{
ObjectMove("DR Label", 0, Time[50], dr);
}

//---- Set lines on chart window

if(ObjectFind("DS Line") != 0)
{
ObjectCreate("DS Line", OBJ_HLINE, 0, Time[50], ds);
ObjectSet("DS Line", OBJPROP_STYLE, STYLE_DASHDOT);
ObjectSet("DS Line", OBJPROP_COLOR, Red);
}
else
{
ObjectMove("DS Line", 0, Time[50], ds);
}

if(ObjectFind("DR Line") != 0)
{
ObjectCreate("DR Line", OBJ_HLINE, 0, Time[50], dr);
ObjectSet("DR Line", OBJPROP_STYLE, STYLE_DASHDOT);
ObjectSet("DR Line", OBJPROP_COLOR, Lime);
}
else
{
ObjectMove("DR Line", 0, Time[50], dr);
}

//---- done
return(0);
}

//+------------------------------------------------------------------+
Comments