dex_MACDPVT
Download script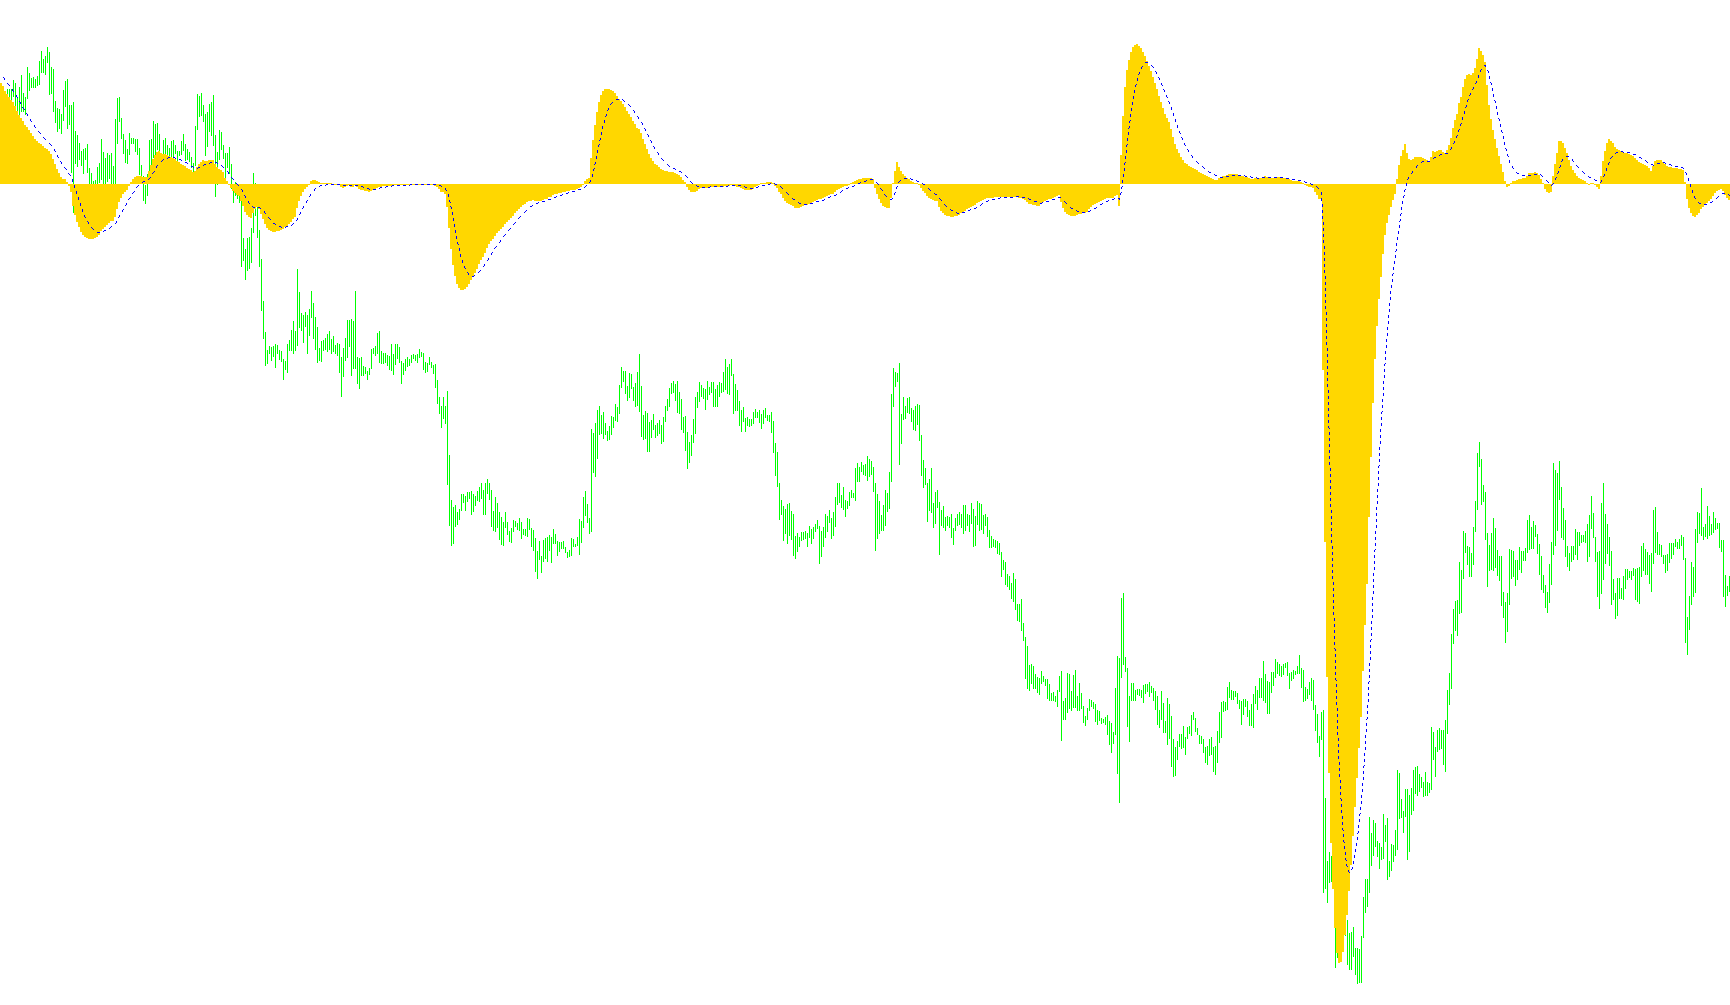
This tool is designed to provide traders with a visual representation of market momentum by combining two fundamental trading components: price movement and trading volume. Rather than looking at price or volume in isolation, this script calculates a specialized metric that measures how much "force" is behind a price change.
How the Logic Works
1. Calculating Raw Momentum (Price Volume Trend) The core logic begins by measuring the percentage change in price from one period to the next. It then multiplies this percentage change by the trading volume for that specific period. By doing this, the script identifies whether price movements are being supported by high trading activity or if they are occurring on low, potentially insignificant volume. This result is accumulated over time to create a continuous trend line of "Price Volume Trend."
2. Smoothing the Data Raw market data can often be erratic and "noisy," making it difficult to see clear trends. To solve this, the script applies two different types of moving averages to the Price Volume Trend:
- Fast Average: A quicker calculation that reacts rapidly to recent price and volume changes.
- Slow Average: A broader calculation that tracks the long-term trend of the data.
3. Generating the Momentum Indicator The primary visual output (the histogram) is created by subtracting the Slow Average from the Fast Average.
- When the Fast Average is significantly higher than the Slow Average, it suggests bullish momentum is accelerating.
- When the Fast Average falls below the Slow Average, it suggests bearish momentum is taking over.
4. The Signal Line Finally, the script adds a secondary "Signal" line. This is a smoothed average of the main momentum histogram. Traders use this to identify potential turning points: when the main momentum histogram crosses over this signal line, it often indicates a shift in the strength of the market trend.
Summary for the User
In simple terms, this indicator tells you not just where the price is going, but how much power is pushing it there. It filters out minor market fluctuations to highlight significant trends where volume and price are moving in harmony.
//+------------------------------------------------------------------+
//|                                                  dex_MACDPVT.mq4 |
//|                                        Copyright © 2006, akadex. |
//|                                                           tohell |
//+------------------------------------------------------------------+

#property copyright "Copyright © 2006, akadex"
#property link      "tohell"

#property indicator_separate_window
#property indicator_buffers 2
#property indicator_color1 DodgerBlue
#property indicator_color2 Red

//---- input parameters
extern int Price     =4;
extern int BarsBack  =1;
extern int SmoothSlow  =26;
extern int SmoothFast  =12;
extern int SmoothSignal=9;
//---- buffers
double PVT[],PVTslow[],PVTfast[],PVTtemp[],PVTSignal[];

//+------------------------------------------------------------------+
//| Custom indicator initialization function                         |
//+------------------------------------------------------------------+
int init()
{
//---- indicator buffer mapping
   IndicatorBuffers(5);
   SetIndexBuffer(0,PVT);
   SetIndexBuffer(1,PVTSignal);
   SetIndexBuffer(2,PVTslow);
   SetIndexBuffer(3,PVTfast);
   SetIndexBuffer(4,PVTtemp);
//---- indicator line
   SetIndexStyle(0,DRAW_HISTOGRAM,STYLE_SOLID,2);
   SetIndexStyle(1,DRAW_LINE,STYLE_DOT,1);
//---- name for DataWindow and indicator subwindow label
   string short_name="dex_MACDPVT("+SmoothSlow+","+SmoothFast+","+SmoothSignal+")";
   IndicatorShortName(short_name);
   SetIndexLabel(0,"MACDPVT");
   SetIndexLabel(1,"PVTSignal");
   SetIndexDrawBegin(0,BarsBack);
   SetIndexDrawBegin(1,BarsBack);

//----
   return(0);
}
//+------------------------------------------------------------------+
//| Price and Volume Trend                                           |
//+------------------------------------------------------------------+
int start()
{
   int   i,limit,counted_bars=IndicatorCounted();
   if(counted_bars>0) counted_bars--;
   if(counted_bars==0) limit=Bars-BarsBack;
   limit=Bars-counted_bars+BarsBack;
//----
   for(i=limit; i>=0; i--)
   {
      if(i==Bars-BarsBack) {PVTtemp[i]=Volume[i];}
      else
      {
      double CurPrice  = iMA(NULL,0,1,0,0,Price,i);
      double PrevPrice = iMA(NULL,0,1,0,0,Price,i+BarsBack);

      if(PrevPrice>0)
      PVTtemp[i] = Volume[i]*(CurPrice-PrevPrice)/PrevPrice + PVTtemp[i+1];

      }
   }
     for(i=limit; i>=0; i--)
     {
     PVTslow[i]=iMAOnArray(PVTtemp,0,SmoothSlow,0,MODE_EMA,i);
     PVTfast[i]=iMAOnArray(PVTtemp,0,SmoothFast,0,MODE_EMA,i);
     PVT[i]=PVTfast[i]-PVTslow[i];
     }
     for(i=limit; i>=0; i--)
     PVTSignal[i]=iMAOnArray(PVT,0,SmoothSignal,0,MODE_EMA,i);

//----
   return(0);
}
Comments