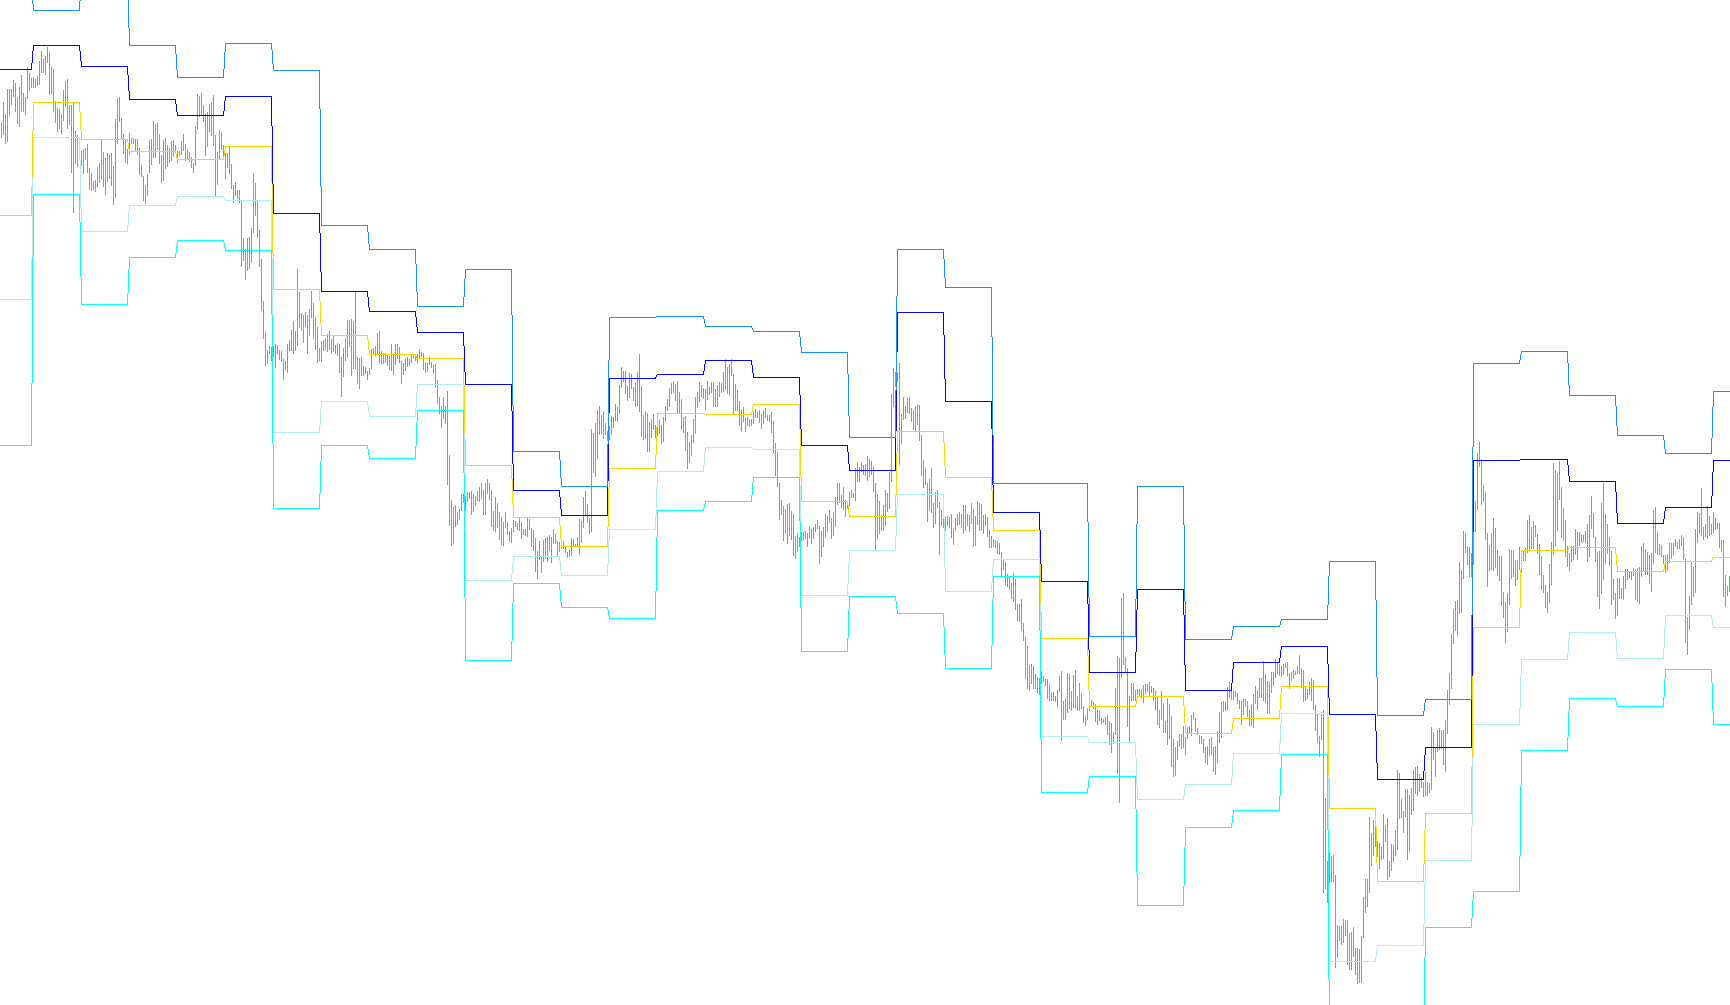
This tool is designed to provide traders with visual key price levels on their charts, specifically utilizing a method known as the Thomas DeMark Daily Pivot system. Its primary goal is to identify potential zones of support and resistance based on historical price action from previous trading sessions.
Core Logic Overview
The script automatically calculates and plots five distinct horizontal levels for every day of the trading period shown on your chart: a central Pivot point, two Resistance levels (R1, R2), and two Support levels (S1, S2).
Instead of using complex guesswork, the tool follows a strict mathematical formula based on the actual price data from the previous day. Here is how it determines those values:
- The Daily Pivot: This serves as the "equilibrium" point for the current day. The script looks at the highest price reached (High), the lowest price reached (Low), and the final price of the day (Close) from yesterday. It then calculates the average of these three figures to establish the center point.
- Support Levels (S1 & S2): These represent "floors" where the price might find buyers or struggle to drop further. They are calculated by taking the difference between the Pivot and yesterday's High/Low prices, projecting those values downward from the central Pivot.
- Resistance Levels (R1 & R2): These represent "ceilings" where the price might encounter selling pressure or face difficulty moving higher. These are projected upward from the Pivot based on the distance to the previous day's price extremes.
How it Functions on Your Chart
The script performs a continuous scan of your historical data. Every time the calendar changes to a new day, the tool automatically pulls the high, low, and close data from the completed previous day and updates the lines for the current day.
By drawing these lines clearly on your screen, the tool allows you to see at a glance where key price boundaries sit. Traders can use these visual cues to identify potential reversal zones or trend continuations, helping to navigate the market with more structured reference points rather than reacting to price movements in isolation.
/*-----------------------------+
|			       |
| Shared by www.Aptrafx.com    |
|			       |
+------------------------------*/

//| DialyPivot.mq4 |
//| These are the main pivots used by Thomas DeMark |
//| Written by: Ice |
//| |
//+------------------------------------------------------------------+
#property copyright "2005 Free software for trader"

#property indicator_chart_window
#property indicator_buffers 7

#property indicator_color1 Blue
#property indicator_color2 Yellow
#property indicator_color3 Red
#property indicator_color4 Green
#property indicator_color5 Lime

//---- input parameters\

datetime BT[];
double YesterdayHigh[50];
double YesterdayLow[50];
double YesterdayClose[50];
//---- buffers

double PivotArray[];
double R1Array[];
double S1Array[];
double R2Array[];
double S2Array[];
double R3Array[];
double S3Array[];
//+------------------------------------------------------------------+
//| Custom indicator initialization function |
//+------------------------------------------------------------------+
int init()
{
//---- indicators
// Pivot
SetIndexStyle(0,DRAW_LINE);
SetIndexBuffer(0,PivotArray);
IndicatorShortName("TDPivot");
SetIndexLabel(0,"Pivot");

// Resistance 1
SetIndexStyle(1,DRAW_LINE);
SetIndexBuffer(1,R1Array);
SetIndexLabel(1,"R1");

// Support 1
SetIndexStyle(2,DRAW_LINE);
SetIndexBuffer(2,S1Array);
SetIndexLabel(2,"R1");

// Resistance 2
SetIndexStyle(3,DRAW_LINE);
SetIndexBuffer(3,R2Array);
SetIndexLabel(3,"R2");

// Support 2
SetIndexStyle(4,DRAW_LINE);
SetIndexBuffer(4,S2Array);
SetIndexLabel(4,"S2");


return(0);
}
//+------------------------------------------------------------------+
//| Custor indicator deinitialization function |
//+------------------------------------------------------------------+
int deinit()
{
return(0);
}
//+------------------------------------------------------------------+
//| Custom indicator iteration function |
//+------------------------------------------------------------------+
int start()
{
int counted_bars=IndicatorCounted();

ArrayResize(BT, Bars); Print("Bars = " + Bars);
// Fill BT with bar open TIME
ArrayCopySeries(BT, MODE_TIME);
// Fill temp arrays with High, Low and Close prices per day
ArrayCopySeries(YesterdayHigh, MODE_HIGH, Symbol(), PERIOD_D1);
ArrayCopySeries(YesterdayLow, MODE_LOW, Symbol(), PERIOD_D1);
ArrayCopySeries(YesterdayClose, MODE_CLOSE, Symbol(), PERIOD_D1);

int od = 0;
int dd = 0;


double Pivot;
double R1;
double S1;
double R2;
double S2;

//Cycle through all the bars and fill the indicator bars with the Pivot point values
for (int i = 0; i <= Bars; i++) {
if (TimeDay(BT[i]) != od) {
dd++;
Pivot = (YesterdayHigh[dd] + YesterdayLow[dd] + YesterdayClose[dd])/3;
R1 = (2*Pivot)-YesterdayLow[dd];
S1 = (2*Pivot)-YesterdayHigh[dd];
R2 = Pivot-S1+R1;
S2 = Pivot-R1+S1;
od = TimeDay(BT[i]);
}

PivotArray[i] = Pivot;
R1Array[i]=R1;
S1Array[i]=S1;
R2Array[i]=R2;
S2Array[i]=S2;
}
//----
return(0);
}
//+------------------------------------------------------------------+
Comments