DEMA_RLH_v1
Download script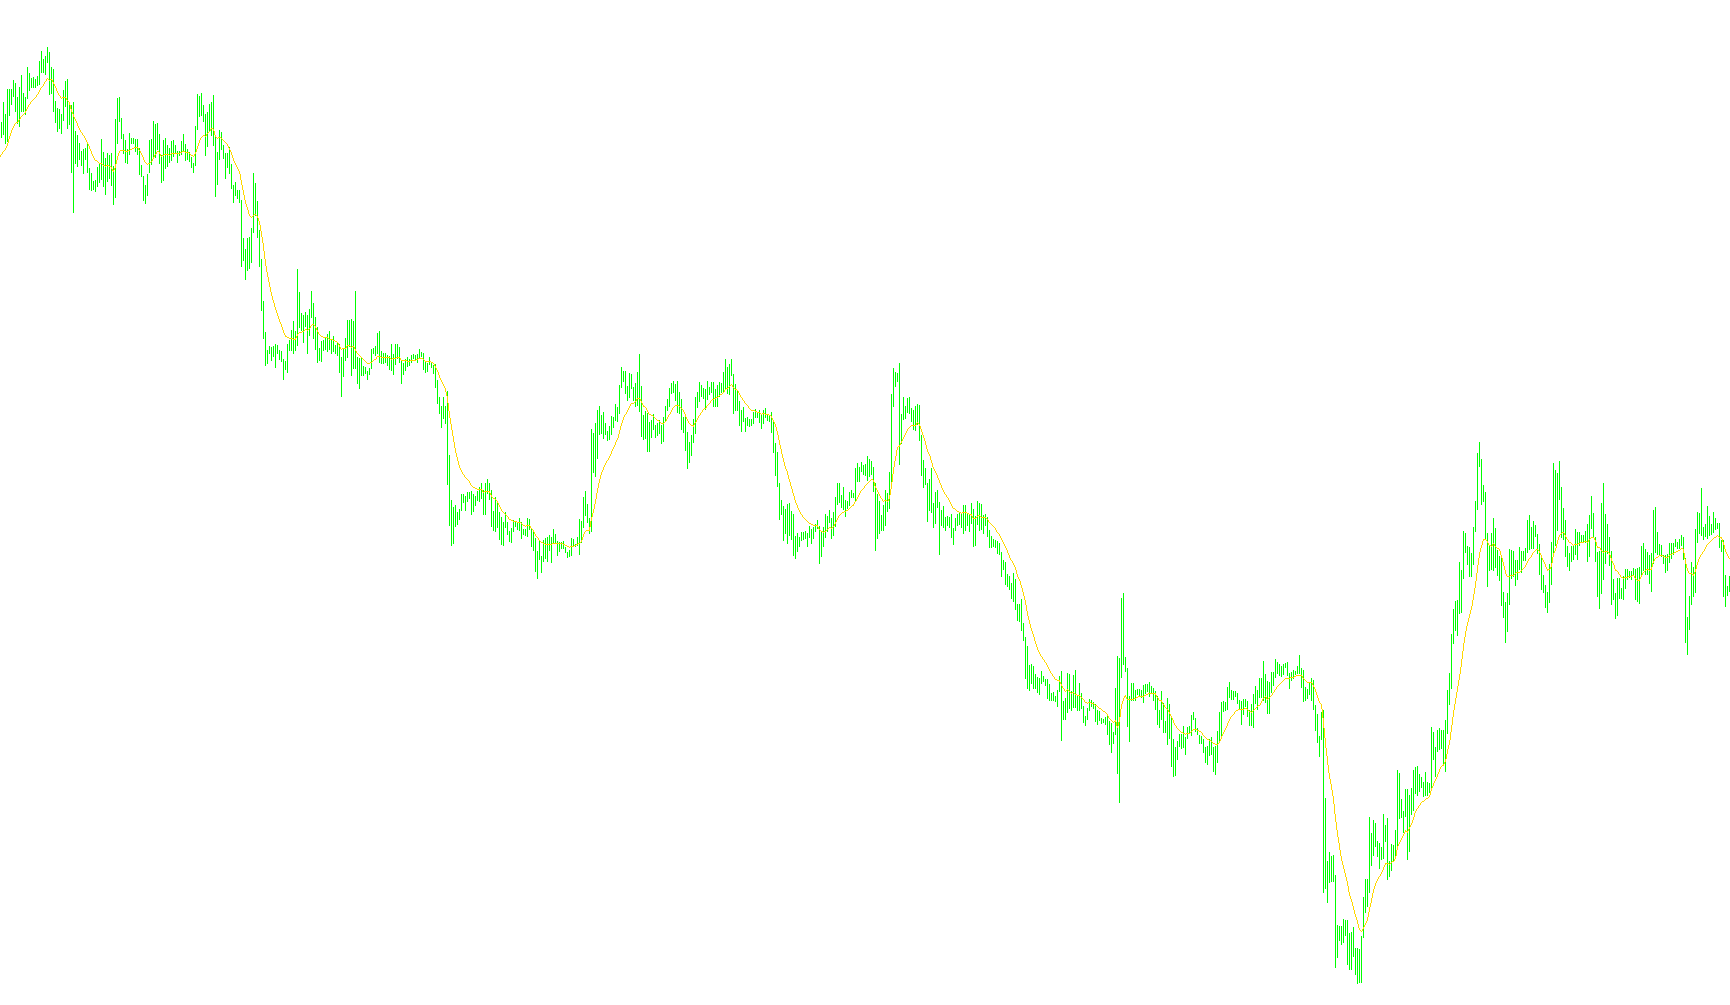
This script is a technical analysis tool designed to provide traders with a more responsive and refined view of price movements compared to standard moving averages. It utilizes a specialized calculation called the Double Exponential Moving Average (DEMA) to help smooth out market "noise" while minimizing the inherent time lag that typically occurs with traditional indicators.
Core Logic and Components
The tool operates by calculating three distinct layers of data simultaneously, which are visualized on your chart using different colors:
- The Base Layer (Red Line): This represents a standard Exponential Moving Average (EMA). It tracks the price trends over a specific period, giving more weight to recent price action.
- The Secondary Layer (Green Line): The script takes the Red Line (the first EMA) and applies a second moving average calculation to it. This is essentially an "average of an average," which serves to further smooth out the data.
- The Final Result (Yellow Line): This is the DEMA. It is calculated by doubling the first EMA and then subtracting the second EMA from that total.
How it Benefits the User
The primary objective of this logic is to solve a common problem in trading: the trade-off between smoothness and speed.
Standard moving averages are often criticized because they "lag" behind the current price—by the time the indicator shows a trend, the move might already be over. Because this script uses the DEMA formula, it manages to retain the smoothness of a double-averaged line while mathematically pulling the result closer to the actual current price.
By visualizing these three components, the tool allows you to see the relationship between the raw trend, its smoothed counterpart, and the accelerated DEMA. This helps in identifying significant momentum shifts and price trends with greater precision than using a single, standard moving average alone.
/*-----------------------------+
|			       |
| Shared by www.Aptrafx.com    |
|			       |
+------------------------------*/

//+------------------------------------------------------------------+
//|                                                   DEMA_RLH       |
//|                                    Copyright © 2006, Robert Hill |
//|                                       http://www.metaquotes.net/ |
//|                                                                  |
//| Based on the formula developed by Patrick Mulloy                 |
//|                                                                  |
//| It can be used in place of EMA or to smooth other indicators.    |
//|                                                                  |
//| DEMA = 2 * EMA - EMA of EMA                                      |
//|                                                                  |
//|  Red is EMA, Green is EMA of EMA, Yellow is DEMA                 |
//|                                                                  |
//+------------------------------------------------------------------+
#property  copyright "Copyright © 2006, Robert Hill "
#property  link      "http://www.metaquotes.net/"

//---- indicator settings
#property  indicator_chart_window
#property  indicator_buffers 3
#property  indicator_color1  Red
#property  indicator_color2  Green
#property  indicator_color3  Yellow
#property  indicator_width1  2
#property  indicator_width2  2
#property  indicator_width3  2

extern int EMA_Period = 14;

//---- buffers
double Dema[];
double Ema[];
double EmaOfEma[];


//+------------------------------------------------------------------+
//| Custom indicator initialization function                         |
//+------------------------------------------------------------------+
int init()
  {

//---- drawing settings

   SetIndexStyle(0,DRAW_LINE);
   SetIndexStyle(1,DRAW_LINE);
   SetIndexStyle(2,DRAW_LINE);
   SetIndexDrawBegin(0,EMA_Period);
   IndicatorDigits(MarketInfo(Symbol(),MODE_DIGITS)+2);

//---- 3 indicator buffers mapping
   if(!SetIndexBuffer(0,Ema) &&
      !SetIndexBuffer(1,EmaOfEma) &&
      !SetIndexBuffer(2,Dema))
      Print("cannot set indicator buffers!");
//---- name for DataWindow and indicator subwindow label
   IndicatorShortName("DEMA("+EMA_Period+")");
//---- initialization done
   return(0);
  }

int start()
{
   int i, limit;
   int    counted_bars=IndicatorCounted();
   if(counted_bars>0) counted_bars--;
   limit=Bars-counted_bars;


   for(i = limit; i >= 0; i--)
       Ema[i] = iMA(NULL,0,EMA_Period,0,MODE_EMA,PRICE_CLOSE,i);
   for(i = limit; i >=0; i--)
       EmaOfEma[i] = iMAOnArray(Ema,Bars,EMA_Period,0,MODE_EMA,i);


//========== COLOR CODING ===========================================

   for(i = limit; i >=0; i--)
       Dema[i] = 2 * Ema[i] - EmaOfEma[i];

      return(0);
  }
//+------------------------------------------------------------------+
Comments