DeMarker_MTF_001
Download script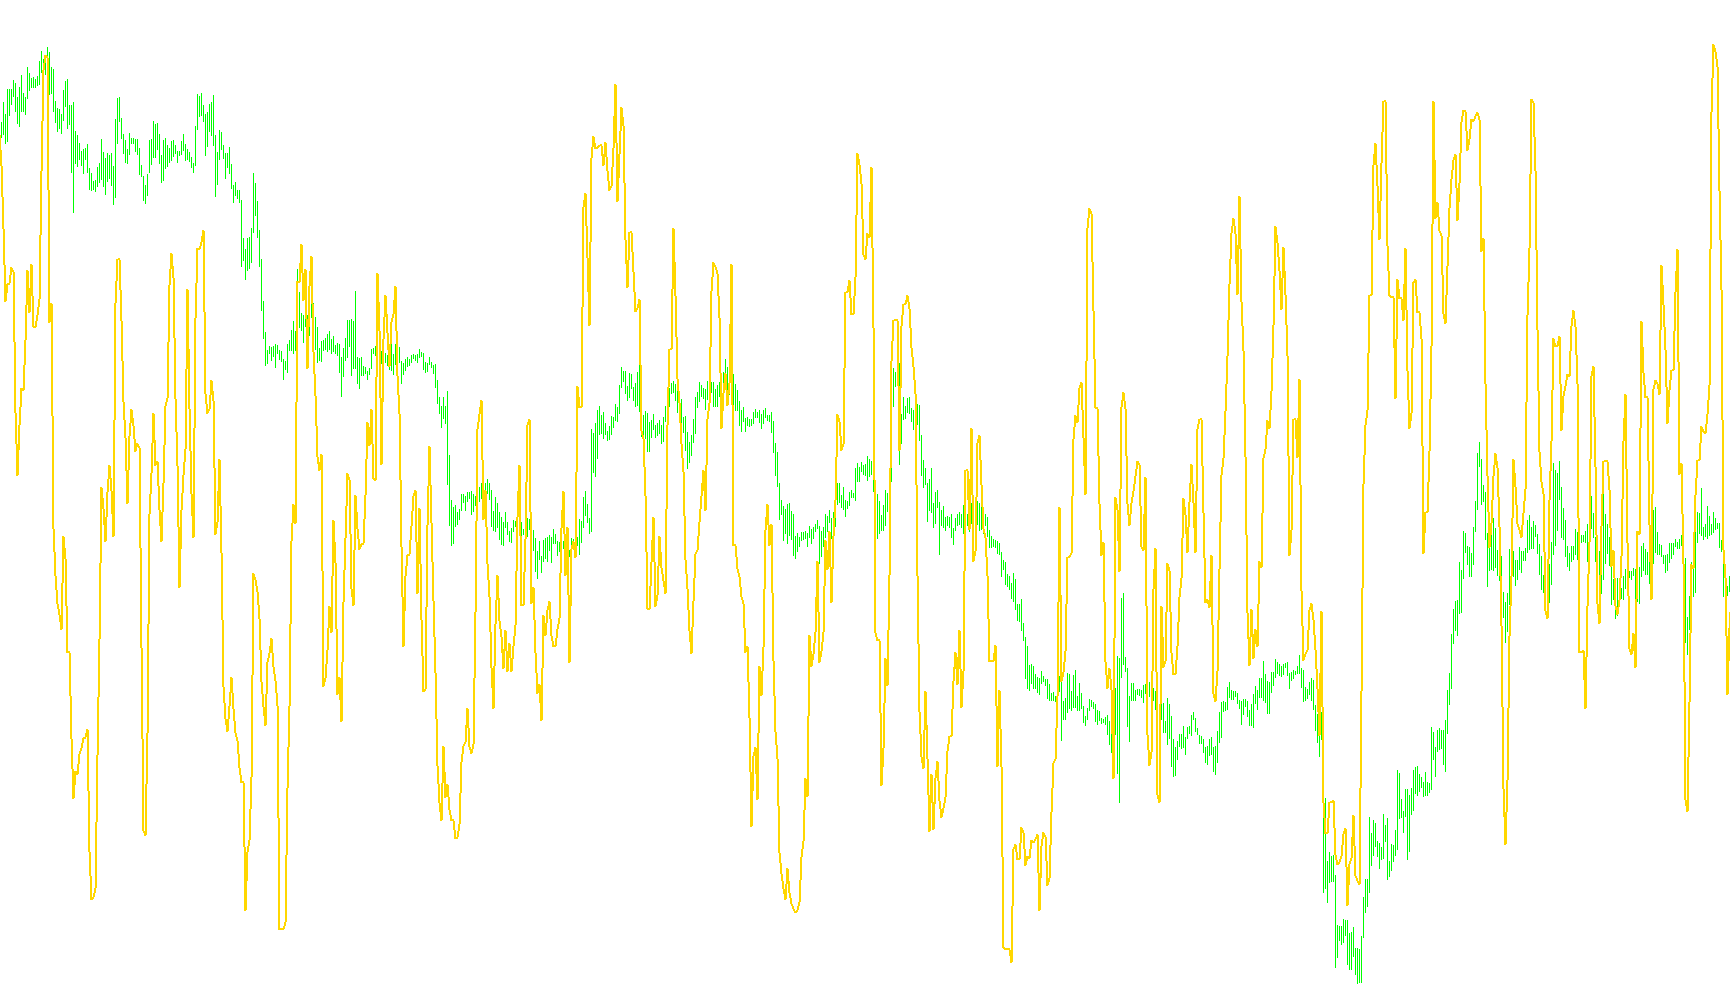
This tool is designed to help traders visualize market momentum by analyzing price action across different time horizons. Instead of looking at just the current chart you are viewing, this script retrieves and displays "DeMarker" data from a specific timeframe that you choose (such as hourly, daily, or weekly).
How it Works
The core logic of this script relies on identifying the "overbought" or "oversold" states of a market based on the relationship between highs and lows over a set period. By pulling this data from a different timeframe than your current view, it allows you to see the broader market trend without changing your main chart's layout.
Key Components of the Logic:
- Multi-Timeframe Integration: The primary purpose of this script is its ability to bridge different timeframes. For example, if you are trading on a 5-minute chart but want to know what the hourly momentum looks like, the script handles the complex math required to sync that data onto your current screen.
- Momentum Tracking: It utilizes a specific mathematical calculation (the DeMarker) to smooth out price fluctuations. This helps filter out "noise" and provides a clearer picture of whether the market is gaining strength or beginning to lose steam.
- Visual Boundaries: The script operates within a defined scale (0 to 1). It includes built-in reference levels at 0.3 and 0.7, which act as visual guides to help you identify when the price action might be reaching extreme territory.
- Dynamic Labeling: To keep your workspace organized, the script automatically identifies the timeframe it is pulling from and updates its display name accordingly. This ensures you always know exactly which time period's data you are looking at.
Summary for the User
In simple terms, this tool acts like a "remote sensor." It goes out to a different time period, checks how strong the market momentum is there, and brings that information back to your current screen. This allows you to make more informed decisions by seeing the "big picture" while focusing on your immediate trades.
//+------------------------------------------------------------------+
//|PARAMS:                                                           |
//|      - TimeFramePeriod: #of minutes in TF.                       |
//|NOTE:                                                             |
//|      - I did not test non-standard TFs or a TimeFramePeriod      |
//|        value less than that of current chart. So they probably   |
//|        won't work.                                               |
//|      - DeMarkerPeriod: self explanatory                          |
//+------------------------------------------------------------------+
#property copyright "Copyright © 2006 ycomp"
#property link      "ycomp"
//----
#define MIN_BARS_REQUIRED 200 // Just a safe amount here. Probably needs much less.
//--- Indicator Settings
#property indicator_separate_window
#property indicator_level1 0.3
#property indicator_level2 0.7
#property indicator_buffers 1
#property indicator_color1 DodgerBlue
#property indicator_width1 2
#property indicator_maximum 1
#property indicator_minimum 0
//---- input parameters
extern int TimeFramePeriod;
extern int DeMarkerPeriod=14;
//---- buffers
double buff[];
//+------------------------------------------------------------------+
//| Custom indicator initialization function                         |
//+------------------------------------------------------------------+
int init()
  {
   if (Bars < MIN_BARS_REQUIRED) return(-1);
   IndicatorDigits(Digits);
   SetIndexStyle(0, DRAW_LINE, STYLE_SOLID, 2);
   SetIndexBuffer(0, buff);
   string paramDesc =
   "(" +
   getPeriodDesc(TimeFramePeriod) + ", " +
   DeMarkerPeriod +
   ")";
   IndicatorShortName("MTF_DeMarker" + paramDesc);
   // Set Index Labels
   SetIndexLabel(0, "MTF_DeM" + paramDesc);
//----
   return(0);
  }
//+------------------------------------------------------------------+
//| Custom indicator deinitialization function                       |
//+------------------------------------------------------------------+
int deinit()
  {
//----
//----
   return(0);
  }
//+------------------------------------------------------------------+
//|                                                                  |
//+------------------------------------------------------------------+
  string getPeriodDesc(int aNumMinutes)
  {
     switch(aNumMinutes)
     {
         case PERIOD_M1 : return("M1");
         case PERIOD_M15: return("M15");
         case PERIOD_M30: return("M30");
         case PERIOD_H1 : return("H1");
         case PERIOD_H4 : return("H4");
         case PERIOD_D1 : return("D1");
         case PERIOD_W1 : return("W1");
         case PERIOD_MN1: return("MN1");
         case 0: return("Chart");
         default: return("M" + aNumMinutes);
        }
     }
//+------------------------------------------------------------------+
//|                                                                  |
//+------------------------------------------------------------------+
           double getDeMarker(int aShift)
           {
            return(iDeMarker(NULL, TimeFramePeriod, 13, iBarShift(NULL, TimeFramePeriod, Time[aShift])));
           }
//+------------------------------------------------------------------+
//|                                                                  |
//+------------------------------------------------------------------+
           int start()
           {
            for(int shift=Bars-1;shift>=0;shift--)
              {
               buff[shift]=getDeMarker(shift);
              }
            return(0);
           }
//+------------------------------------------------------------------+
Comments