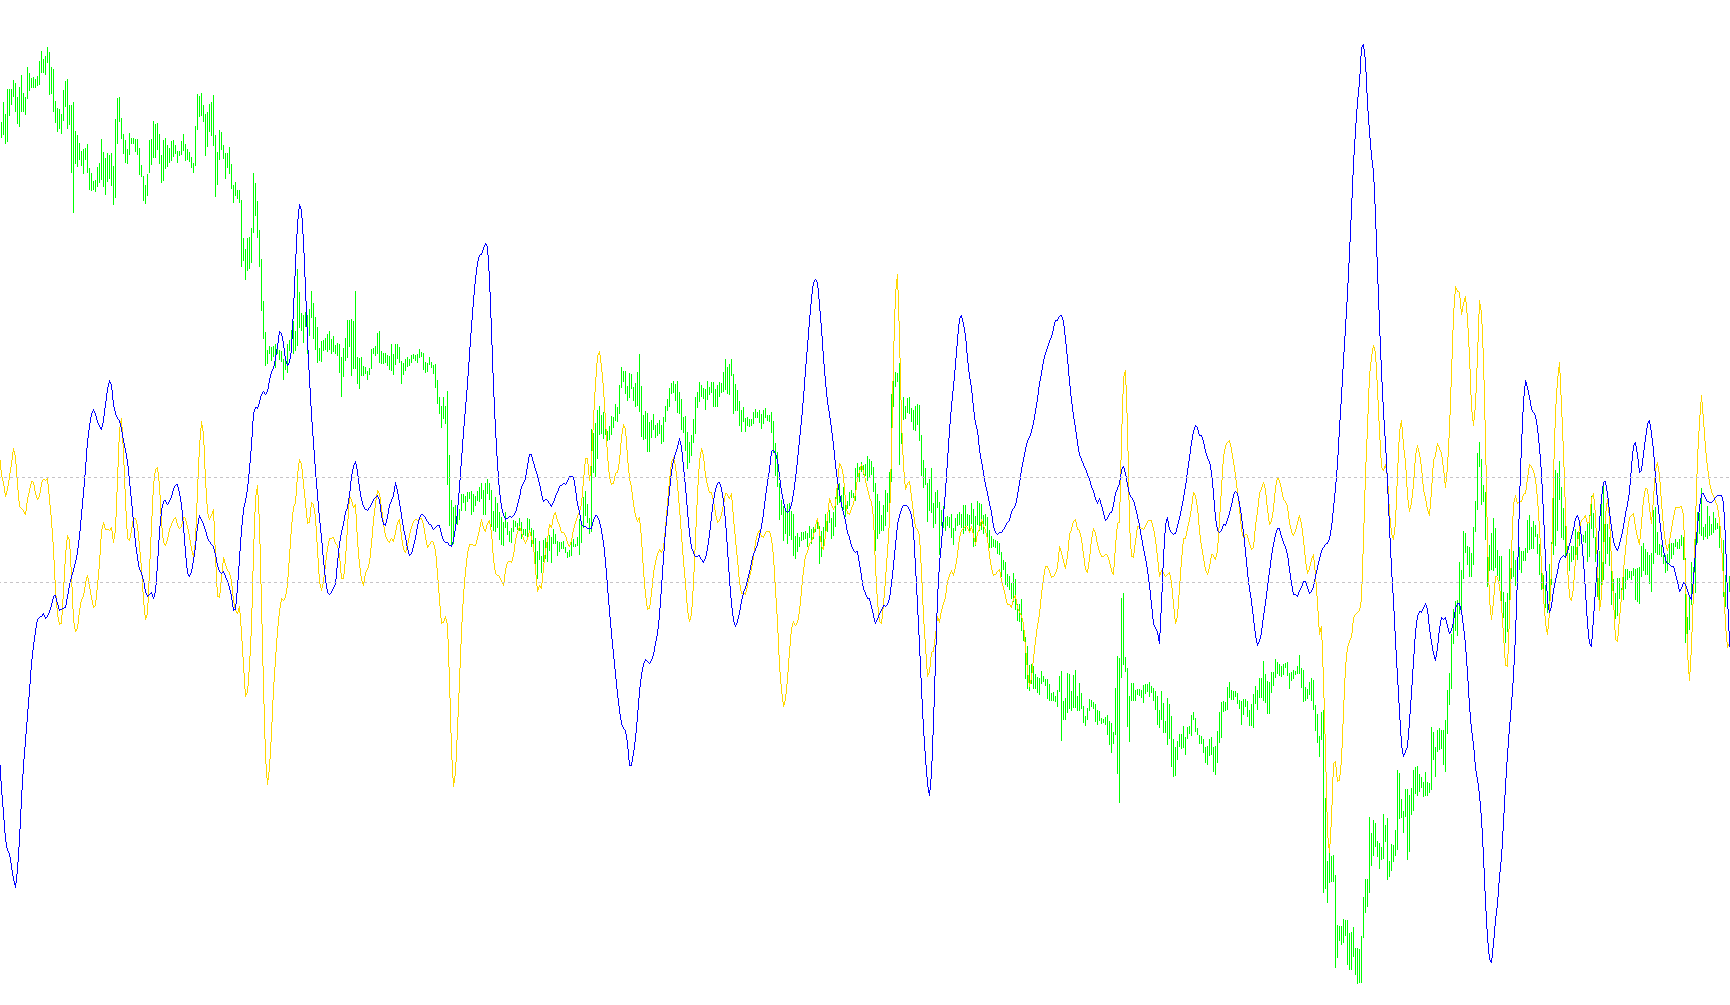
This tool is designed to provide visual data analysis for traders by calculating specific mathematical relationships between market price movements and moving averages. It generates two distinct lines on a separate window, allowing you to observe different "speeds" of market reaction simultaneously.
Core Logic and Functionality
Data Processing Strategy The script operates by looking at historical price data—specifically the High and Low prices of previous candles—to determine the midpoint of the market's action. It performs a dual-layer calculation where it compares raw price behavior against smoothed average trends (Simple Moving Averages).
Weighted Mathematical Analysis Instead of simply looking at the most recent price, the logic applies a weighting system. It calculates:
- Price Volatility: It evaluates how current prices are moving relative to their historical weight.
- Trend Smoothing: It compares these weighted values against a smoothed average to identify discrepancies between where the market is and where the trend suggests it should be.
Logarithmic Output The final result of these calculations is converted into a logarithmic value. In practical terms, this helps normalize the data, making it easier to see subtle shifts in momentum that might otherwise be hidden by large price swings. This allows for a clearer view of "acceleration" or "deceleration" in the market.
Dual-Speed Visualization The script provides two different versions of this calculation at once:
- Fast Line (Yellow): Uses a shorter lookback period to react quickly to immediate price changes and sudden shifts in momentum.
- Slow Line (Red): Uses a longer lookback period to provide a broader view of the market trend, filtering out "noise" and minor fluctuations.
How to Read the Results
By observing the two lines on your screen:
- When both lines move in harmony, it suggests a consistent trend.
- When the lines diverge or move at different rates, it indicates a change in the speed of the market movement or a potential shift in momentum.
- The silver levels provided (0.4 and -0.4) act as visual boundaries to help you identify when the mathematical relationship between price and trend reaches an extreme state.
//+------------------------------------------------------------------+
//| CoeffofLine_v1.mq4
//| Kalenzo - Conversion only
//| I added also second line
//| bartlomiej.gorski@gmail.com
//+------------------------------------------------------------------+

#property indicator_separate_window
#property indicator_buffers 2
#property indicator_color1 Yellow
#property indicator_color2 Red
#property indicator_level1 Silver
#property indicator_level2 Silver

extern int fastSeed = 5;
extern int slowSeed = 20;
//---- buffers
double cfl[];
double cfl2[];

//+------------------------------------------------------------------+
//| Custom indicator initialization function                         |
//+------------------------------------------------------------------+
int init()
  {
   string short_name;
//---- indicator line
   IndicatorBuffers(2);
   SetIndexStyle(0,DRAW_LINE);
   SetIndexBuffer(0,cfl);
   SetLevelValue( 0, 0.4);
   SetLevelValue( 1, -0.4);


   SetIndexStyle(1,DRAW_LINE);
   SetIndexBuffer(1,cfl2);
//----
   return(0);
  }
//+------------------------------------------------------------------+
//| CoeffofLine                                                              |
//+------------------------------------------------------------------+
int start()
  {

   int limit;
   int counted_bars=IndicatorCounted();
   if(counted_bars<0) counted_bars=0;
   if(counted_bars>0) counted_bars--;
   limit=Bars-counted_bars;
   counted_bars=limit;

   int i,shift,cnt,ndot1,ndot=fastSeed,ndot2=slowSeed;
   double TYVar,ZYVar,TIndicatorVar,ZIndicatorVar,M,N,AY,AIndicator;

   for(shift = limit ;shift>=0;shift--)
   {

      TYVar=0;
	   ZYVar=0;
	   N=0;
	   M=0;
	   TIndicatorVar=0;
	   ZIndicatorVar=0;

	  for (cnt = ndot; cnt>=1; cnt--)
	  {
		  ZYVar+=(High[shift+cnt-1]+Low[shift+cnt-1])/2*(6-cnt);
		  TYVar+=(High[shift+cnt-1]+Low[shift+cnt-1])/2;

		  ZIndicatorVar=ZIndicatorVar+iMA(NULL,0,5,3,MODE_SMMA,PRICE_MEDIAN,shift+cnt-1)*(6-cnt);
		  TIndicatorVar=TIndicatorVar+iMA(NULL,0,5,3,MODE_SMMA,PRICE_MEDIAN,shift+cnt-1);

   	  AY=(TYVar+(55-2*ZYVar)*5/15)/15;
   	  AIndicator=(TIndicatorVar+(55-2*ZIndicatorVar)*5/15)/15;
     }

	cfl[shift]=(-1000)*MathLog(AY/AIndicator);


	   TYVar=0;
	   ZYVar=0;
	   N=0;
	   M=0;
	   TIndicatorVar=0;
	   ZIndicatorVar=0;

	  for (cnt = ndot2; cnt>=1; cnt--)
	  {
		  ZYVar+=(High[shift+cnt-1]+Low[shift+cnt-1])/2*(6-cnt);
		  TYVar+=(High[shift+cnt-1]+Low[shift+cnt-1])/2;

		  ZIndicatorVar=ZIndicatorVar+iMA(NULL,0,5,3,MODE_SMMA,PRICE_MEDIAN,shift+cnt-1)*(6-cnt);
		  TIndicatorVar=TIndicatorVar+iMA(NULL,0,5,3,MODE_SMMA,PRICE_MEDIAN,shift+cnt-1);

   	  AY=(TYVar+(55-2*ZYVar)*5/15)/15;
   	  AIndicator=(TIndicatorVar+(55-2*ZIndicatorVar)*5/15)/15;
     }

	  cfl2[shift]=(-1000)*MathLog(AY/AIndicator);


   }
   return(0);
  }
//+------------------------------------------------------------------+
Comments