CoeffoLine_Hist2
Download script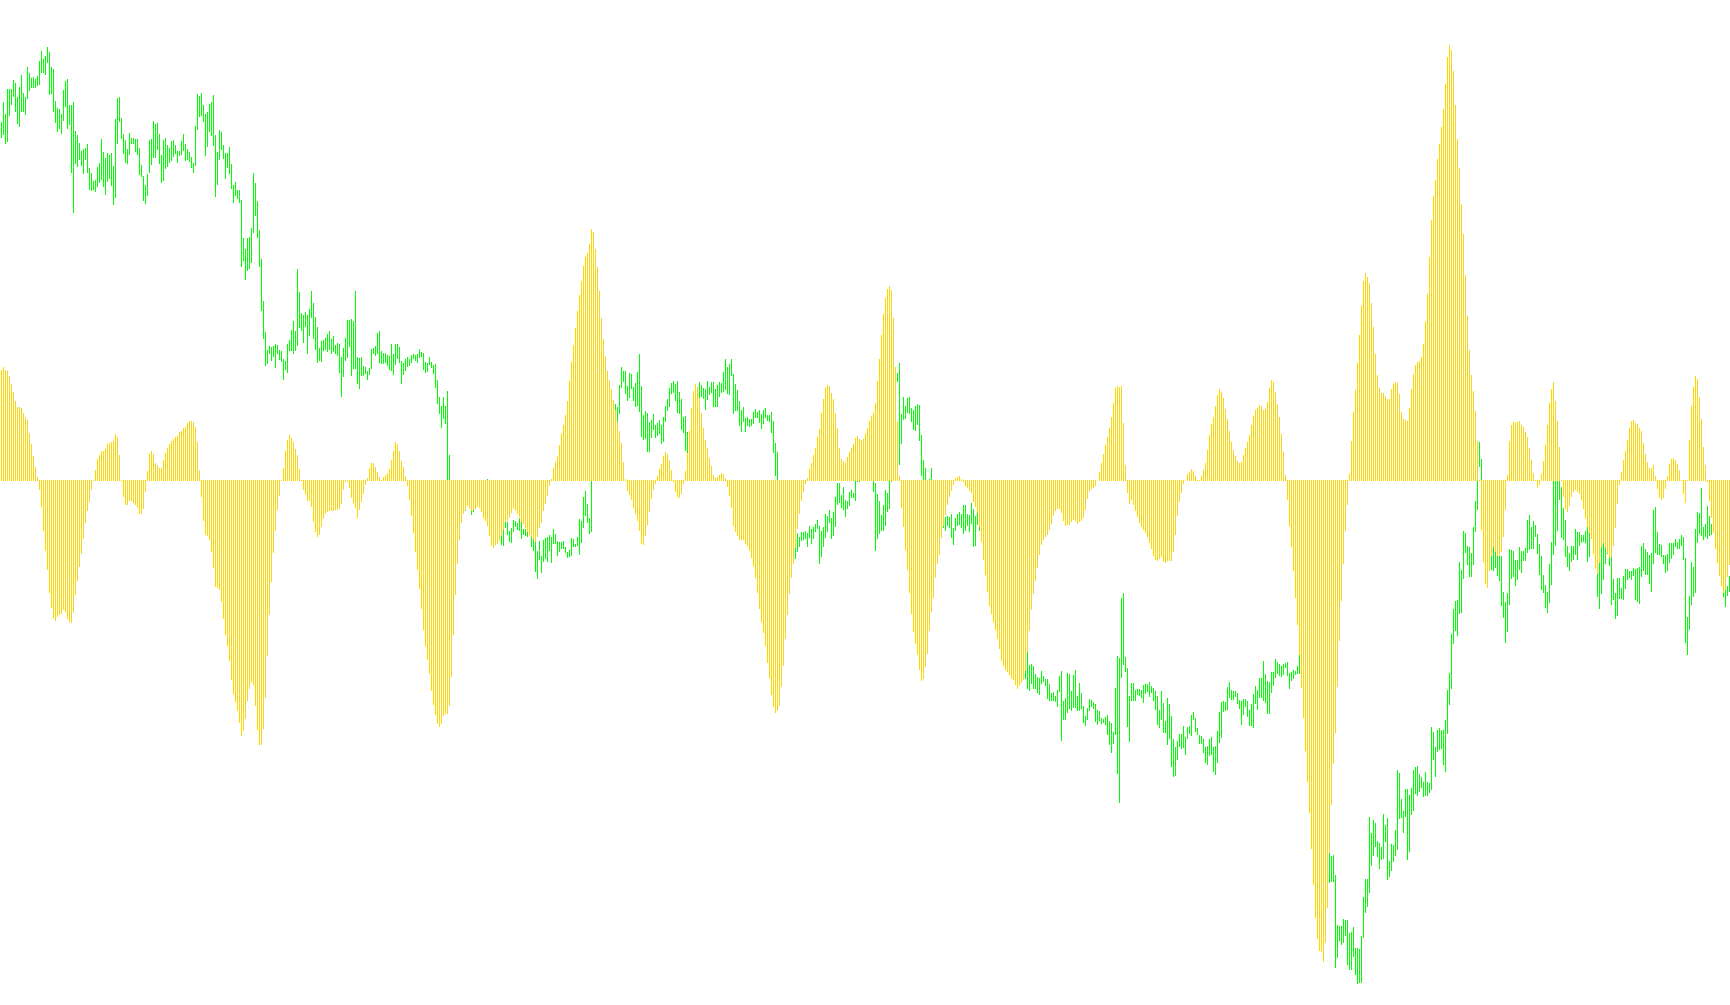
This tool is designed to analyze price action on a trading chart by calculating the relationship between two different types of moving averages. It specifically looks at the "distance" or discrepancy between a standard smoothed average and a weighted version of that same average to identify market behavior.
How it Works
The script operates by performing the following logic:
- Data Collection: It examines a specific number of past price candles (the "lookback period"). For every point in time, it captures the highest and lowest prices to determine the middle price point.
- Dual Average Calculation: The tool creates two distinct mathematical values for each point on the chart:
- A Standard Average: This treats all recent price points with equal importance.
- A Weighted Average: This gives more significance to certain data points within the range, effectively "weighting" the calculation.
- The Comparison: The script then compares these two averages against each other. By calculating the ratio between the Weighted Average and the Standard Average, it measures how much the recent price action is deviating from its historical norm.
- Logarithmic Scaling: To make this comparison readable on a chart, the tool applies a logarithmic calculation to the result. This translates the mathematical difference into a visible value that fluctuates based on market volatility and trend strength.
Visual Representation
The output is displayed as a histogram in a separate window below the main price chart.
- Trend Identification: The script features a built-in logic gate that detects specific major currency pairs (such as EURUSD, GBPUSD, etc.).
- Directional Adjustment: Depending on which currency pair you are viewing, the tool automatically flips the calculation logic. This ensures that the histogram reflects the data consistently across different markets, allowing you to see deviations regardless of whether the currency is behaving in a standard or inverted manner relative to the calculated averages.
In short, this script serves as a "divergence" tracker. It highlights when the current price momentum is pulling away from its smoothed average, providing a visual signal of potential trend strength or exhaustion.
Indicators Used
Miscellaneous
14
Views
1
Downloads
0
Favorites
CoeffoLine_Hist2
//compile//
//+------------------------------------------------------------------+
//| CoeffofLine.mq4
//| Ramdass - Conversion only
//+------------------------------------------------------------------+

#property indicator_separate_window
#property indicator_buffers 1
#property indicator_color1 Red


extern int ndot=30;
extern int CountBars=10000;
//---- buffers
double cfl[];


//+------------------------------------------------------------------+
//| Custom indicator initialization function                         |
//+------------------------------------------------------------------+
int init()
  {
   string short_name;
//---- indicator line
   IndicatorBuffers(1);
   SetIndexStyle(0,DRAW_HISTOGRAM);
   SetIndexBuffer(0,cfl);
//----
   return(0);
  }
//+------------------------------------------------------------------+
//| CoeffofLine_v1                                                              |
//+------------------------------------------------------------------+
int start()
  {


   if (CountBars>=Bars) CountBars=Bars;
   SetIndexDrawBegin(0,Bars-CountBars+ndot+1);
   int i,shift,cnt,ndot1,counted_bars=IndicatorCounted();
   double TYVar,ZYVar,TIndicatorVar,ZIndicatorVar,M,N,AY,AIndicator;
//----
   if(Bars<=ndot) return(0);

//----
   shift=CountBars-ndot-1;


   while(shift>=0)
     {

   TYVar=0;
	ZYVar=0;
	N=0;
	M=0;
	TIndicatorVar=0;
	ZIndicatorVar=0;
	ndot1=ndot;
	if (shift+1<ndot1) ndot1=shift+1;
	for (cnt=ndot; cnt>=1; cnt--) // n=5 -  ïî ïÿòè òî÷êàì
	{
		N=N+cnt*cnt;  //ðàâíî 55
		M=M+cnt;      //ðàâíî 15
	}
	for (cnt=ndot1; cnt>=1; cnt--) // n=5 -  ïî ïÿòè òî÷êàì
	{
		ZYVar=ZYVar+(High[shift-cnt+1]+Low[shift-cnt+1])/2*(ndot+1-cnt);
		TYVar=TYVar+(High[shift-cnt+1]+Low[shift-cnt+1])/2;
		ZIndicatorVar=ZIndicatorVar+iMA(NULL,0,5,3,MODE_SMMA,PRICE_MEDIAN,shift-cnt+1)*(ndot+1-cnt);
		TIndicatorVar=TIndicatorVar+iMA(NULL,0,5,3,MODE_SMMA,PRICE_MEDIAN,shift-cnt+1);
	}
	AY=(TYVar+(N-2*ZYVar)*ndot/M)/M;
	AIndicator=(TIndicatorVar+(N-2*ZIndicatorVar)*ndot/M)/M;
	if (Symbol()=="EURUSD" || Symbol()=="GBPUSD" || Symbol()=="USDCAD" || Symbol()=="USDCHF"
	 || Symbol()=="EURGBP" || Symbol()=="EURCHF" || Symbol()=="AUDUSD"
	 || Symbol()=="GBPCHF")
	{cfl[shift]=(-1000)*MathLog(AY/AIndicator);}
	else {cfl[shift]=(1000)*MathLog(AY/AIndicator);}


      shift--;
     }
   return(0);
  }
//+------------------------------------------------------------------+
Comments