CoeffoLine_Hist_001
Download script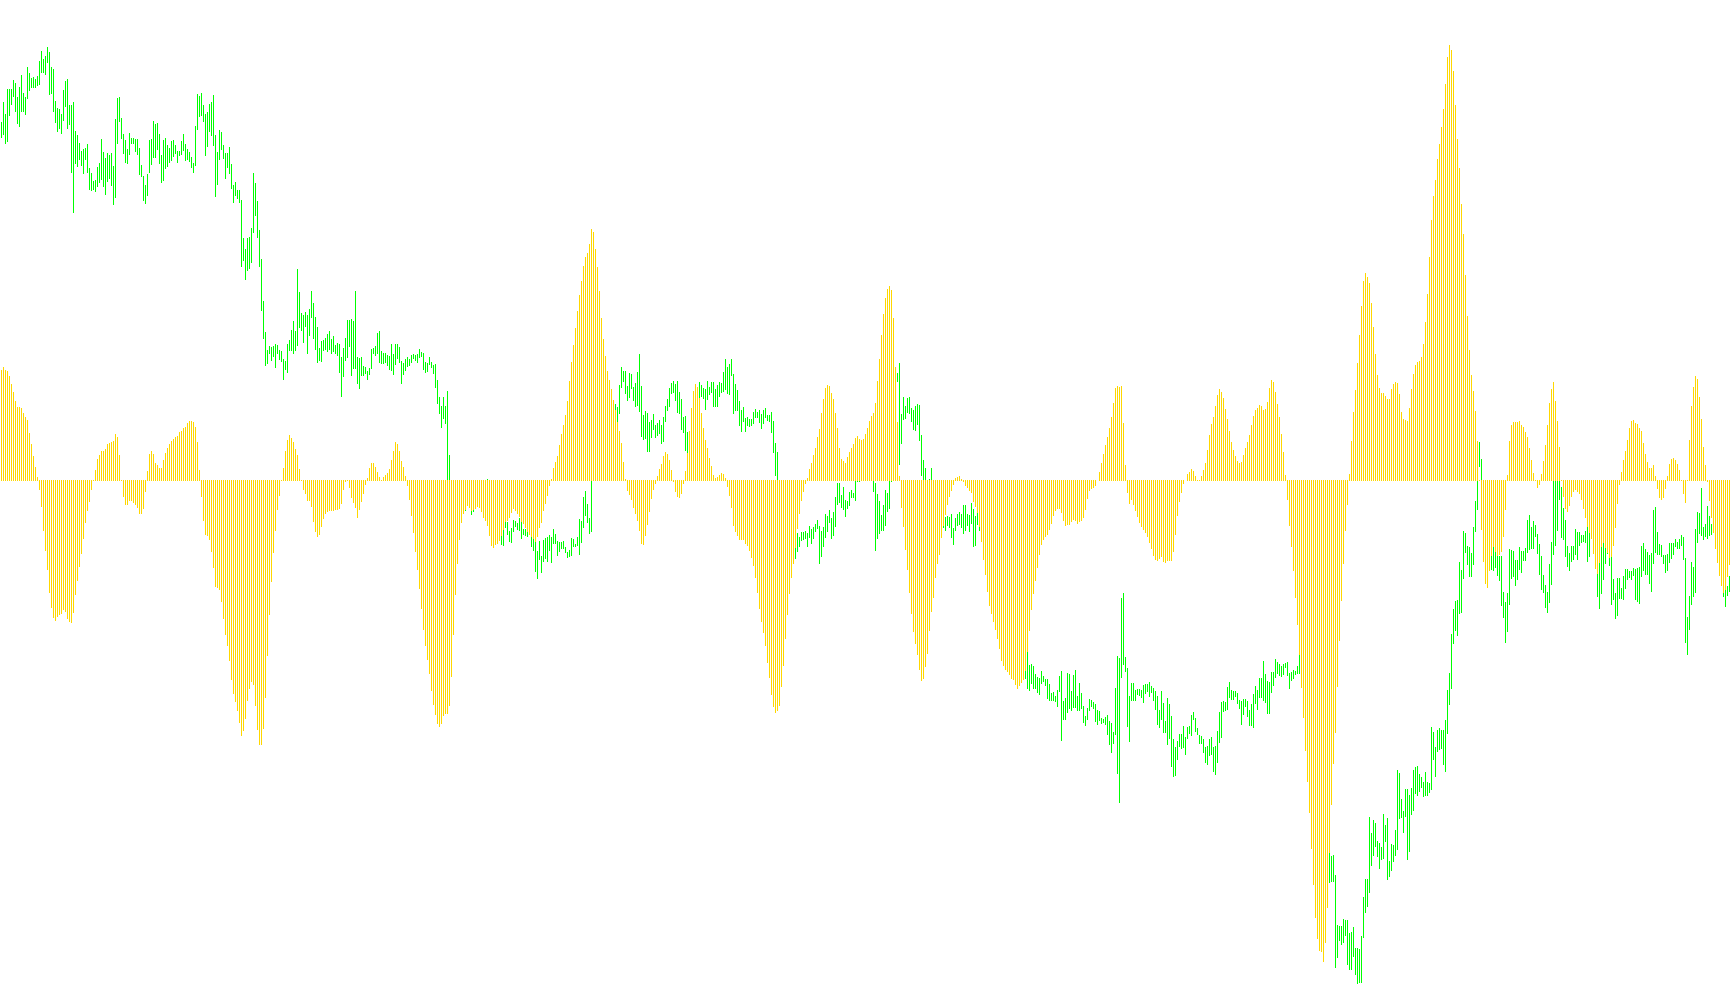
This script is designed to work as a custom technical indicator for trading platforms. Its primary purpose is to analyze price action and generate a specific visual metric—a "Coefficient of Line"—which appears in a separate window below the main price chart.
Core Logic and Methodology
The indicator operates by looking back at a significant amount of historical data (defined by the user) to calculate a mathematical relationship between two different types of price averages. Here is a breakdown of how it processes that information:
1. Data Gathering and Weighting The script scans through recent price bars, specifically focusing on the "Median Price" (the midpoint between the highest and lowest price of a candle). It doesn't just look at the current price; it performs a complex weighted calculation. It assigns different importance to older prices versus more recent ones, creating a smoothed representation of the market's movement over a specific period.
2. Dual Calculation Paths The logic creates two distinct mathematical models simultaneously:
- Model A (Raw Price Movement): This calculates a weighted average based directly on the raw high and low prices of the candles.
- Model B (Smoothed Indicator Movement): This calculates a weighted average based on a "Smoothed Moving Average" (SMMA). By comparing the raw price movement against a smoothed version of itself, the script can identify how much the current market is deviating from its established trend.
3. The Coefficient Calculation The heart of the script lies in the comparison between Model A and Model B. It calculates the ratio between these two values and applies a logarithmic transformation. This "logarithmic" approach is often used in finance to normalize data, making it easier to see relative changes regardless of whether the price is at $10 or $10,000.
4. Dynamic Adjustment for Specific Markets The script contains a unique conditional rule based on the specific currency pair being traded. It recognizes a specific group of major forex pairs (such as EURUSD, GBPUSD, etc.).
- For these specific pairs, it applies one mathematical direction to the final result.
- For all other assets, it flips the mathematical direction. This suggests the indicator is calibrated to account for different market behaviors or "biases" found in various currency markets.
Visual Output
The final result is displayed as a histogram. Instead of showing you a simple price line, this visual representation allows traders to see the intensity and direction of the relationship between the raw price action and the smoothed trend. A larger move in the histogram indicates a significant divergence or convergence between the market's immediate momentum and its long-term average.
//+------------------------------------------------------------------+
//| CoeffofLine.mq4
//| Ramdass - Conversion only
//+------------------------------------------------------------------+

#property indicator_separate_window
#property indicator_buffers 1
#property indicator_color1 Red


extern int ndot=30;
extern int CountBars=10000;
//---- buffers
double cfl[];


//+------------------------------------------------------------------+
//| Custom indicator initialization function                         |
//+------------------------------------------------------------------+
int init()
  {
   string short_name;
//---- indicator line
   IndicatorBuffers(1);
   SetIndexStyle(0,DRAW_HISTOGRAM);
   SetIndexBuffer(0,cfl);
//----
   return(0);
  }
//+------------------------------------------------------------------+
//| CoeffofLine_v1                                                              |
//+------------------------------------------------------------------+
int start()
  {


   if (CountBars>=Bars) CountBars=Bars;
   SetIndexDrawBegin(0,Bars-CountBars+ndot+1);
   int i,shift,cnt,ndot1,counted_bars=IndicatorCounted();
   double TYVar,ZYVar,TIndicatorVar,ZIndicatorVar,M,N,AY,AIndicator;
//----
   if(Bars<=ndot) return(0);

//----
   shift=CountBars-ndot-1;


   while(shift>=0)
     {

   TYVar=0;
	ZYVar=0;
	N=0;
	M=0;
	TIndicatorVar=0;
	ZIndicatorVar=0;
	ndot1=ndot;
	if (shift+1<ndot1) ndot1=shift+1;
	for (cnt=ndot; cnt>=1; cnt--) // n=5 -  ïî ïÿòè òî÷êàì
	{
		N=N+cnt*cnt;  //ðàâíî 55
		M=M+cnt;      //ðàâíî 15
	}
	for (cnt=ndot1; cnt>=1; cnt--) // n=5 -  ïî ïÿòè òî÷êàì
	{
		ZYVar=ZYVar+(High[shift-cnt+1]+Low[shift-cnt+1])/2*(ndot+1-cnt);
		TYVar=TYVar+(High[shift-cnt+1]+Low[shift-cnt+1])/2;
		ZIndicatorVar=ZIndicatorVar+iMA(NULL,0,5,3,MODE_SMMA,PRICE_MEDIAN,shift-cnt+1)*(ndot+1-cnt);
		TIndicatorVar=TIndicatorVar+iMA(NULL,0,5,3,MODE_SMMA,PRICE_MEDIAN,shift-cnt+1);
	}
	AY=(TYVar+(N-2*ZYVar)*ndot/M)/M;
	AIndicator=(TIndicatorVar+(N-2*ZIndicatorVar)*ndot/M)/M;
	if (Symbol()=="EURUSD" || Symbol()=="GBPUSD" || Symbol()=="USDCAD" || Symbol()=="USDCHF"
	 || Symbol()=="EURGBP" || Symbol()=="EURCHF" || Symbol()=="AUDUSD"
	 || Symbol()=="GBPCHF")
	{cfl[shift]=(-1000)*MathLog(AY/AIndicator);}
	else {cfl[shift]=(1000)*MathLog(AY/AIndicator);}


      shift--;
     }
   return(0);
  }
//+------------------------------------------------------------------+
Comments