CoeffofLine_true
Download script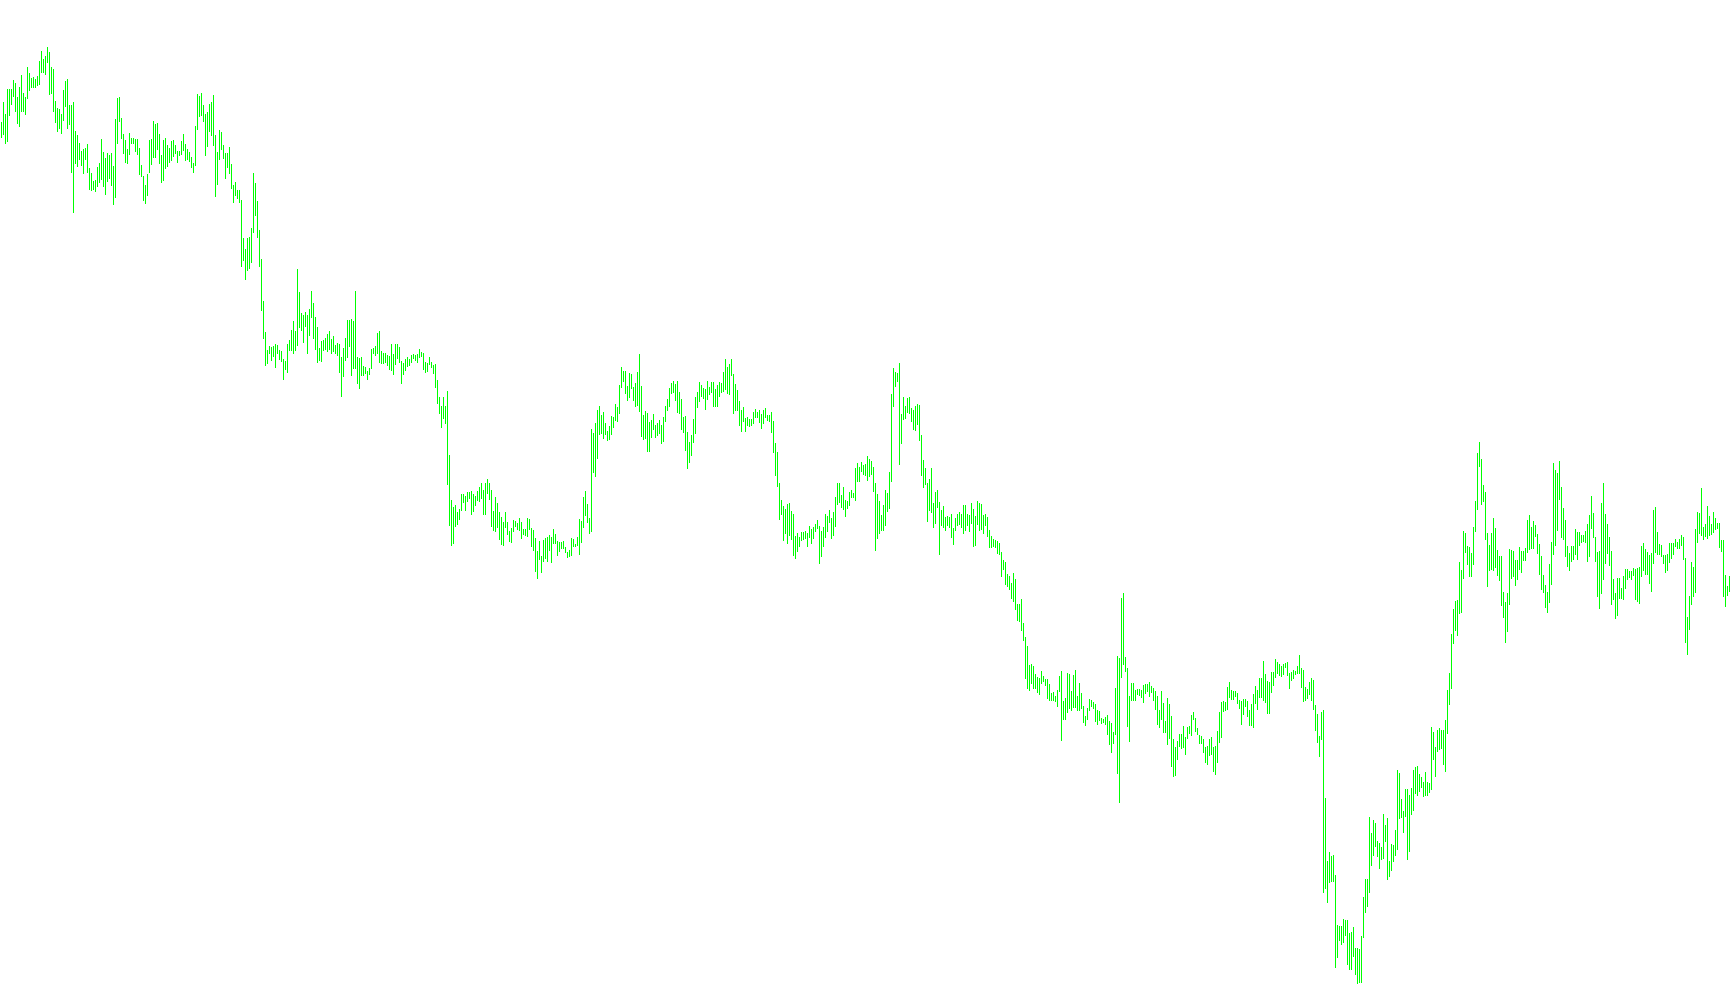
This tool is designed as a visual indicator for trading platforms, providing a calculated line that helps traders interpret price momentum and trends. Instead of simply looking at the current price, the logic focuses on analyzing the relationship between recent price extremes and smoothed moving averages to identify underlying market behavior.
How the Logic Works
1. Data Collection & Averaging The script looks back at a specific window of recent candles (determined by the user settings). For each point in time, it calculates the "median" price—the midpoint between the highest and lowest prices reached during that period. It then takes these values and compares them against a smoothed moving average.
2. Weighted Analysis The core of the logic involves a weighted calculation. Rather than treating every past candle as having equal importance, the script applies a specific mathematical weighting to the price data over a 5-point look-back period. This helps the indicator prioritize more recent movements while still accounting for the immediate past.
3. The Comparison Factor The tool essentially creates two different values:
- A value based on raw price extremes (Highs and Lows).
- A value based on a smoothed moving average of those prices.
By comparing these two figures, the script determines how much the current price is deviating from its expected path.
4. Final Output & Visualization The final result is transformed into a logarithmic scale. This "Coefficient" is then plotted as a line in a separate window below your main chart.
Because different currency pairs can behave differently (in terms of volatility and value), the script includes a built-in filter. It automatically detects specific major currency pairs (like EURUSD or GBPUSD) and applies a specific mathematical orientation to the line. For all other assets, it flips the logic to ensure the line remains readable and useful for the trader regardless of which market they are viewing.
//+------------------------------------------------------------------+
//| CoeffofLine_true.mq4
//| Ramdass - Conversion only
//+------------------------------------------------------------------+

#property indicator_separate_window
#property indicator_buffers 1
#property indicator_color1 DarkKhaki


extern int CountBars=300;
//---- buffers
double cfl[];


//+------------------------------------------------------------------+
//| Custom indicator initialization function                         |
//+------------------------------------------------------------------+
int init()
  {
   string short_name;
//---- indicator line
   IndicatorBuffers(1);
   SetIndexStyle(0,DRAW_LINE);
   SetIndexBuffer(0,cfl);
//----
   return(0);
  }
//+------------------------------------------------------------------+
//| CoeffofLine_true                                                              |
//+------------------------------------------------------------------+
int start()
  {


   if (CountBars>=Bars) CountBars=Bars;
   SetIndexDrawBegin(0,Bars-CountBars+5+1);
   int i,shift,cnt,ndot1,ndot=5,counted_bars=IndicatorCounted();
   double TYVar,ZYVar,TIndicatorVar,ZIndicatorVar,M,N,AY,AIndicator;
//----
   if(Bars<=ndot) return(0);

//----
   shift=CountBars-ndot-1;


   while(shift>=0)
     {

   TYVar=0;
	ZYVar=0;
	N=0;
	M=0;
	TIndicatorVar=0;
	ZIndicatorVar=0;
	ndot1=ndot;

	for (cnt=ndot; cnt>=1; cnt--) // n=5 -  ïî ïÿòè òî÷êàì
	{
	   ZYVar=ZYVar+(High[shift+cnt-1]+Low[shift+cnt-1])/2*(6-cnt);
		TYVar=TYVar+(High[shift+cnt-1]+Low[shift+cnt-1])/2;
		N=N+cnt*cnt; //ðàâíî 55
		M=M+cnt; //ðàâíî 15
		ZIndicatorVar=ZIndicatorVar+iMA(NULL,0,5,3,MODE_SMMA,PRICE_MEDIAN,shift+cnt-1)*(6-cnt);
		TIndicatorVar=TIndicatorVar+iMA(NULL,0,5,3,MODE_SMMA,PRICE_MEDIAN,shift+cnt-1);

	}
	AY=(TYVar+(N-2*ZYVar)*ndot/M)/M;
	AIndicator=(TIndicatorVar+(N-2*ZIndicatorVar)*ndot/M)/M;
	if (Symbol()=="EURUSD" || Symbol()=="GBPUSD" || Symbol()=="USDCAD" || Symbol()=="USDCHF"
	 || Symbol()=="EURGBP" || Symbol()=="EURCHF" || Symbol()=="AUDUSD"
	 || Symbol()=="GBPCHF")
	{cfl[shift]=(-1000)*MathLog(AY/AIndicator);}
	else {cfl[shift]=(1000)*MathLog(AY/AIndicator);}


      shift--;
     }
   return(0);
  }
//+------------------------------------------------------------------+
Comments