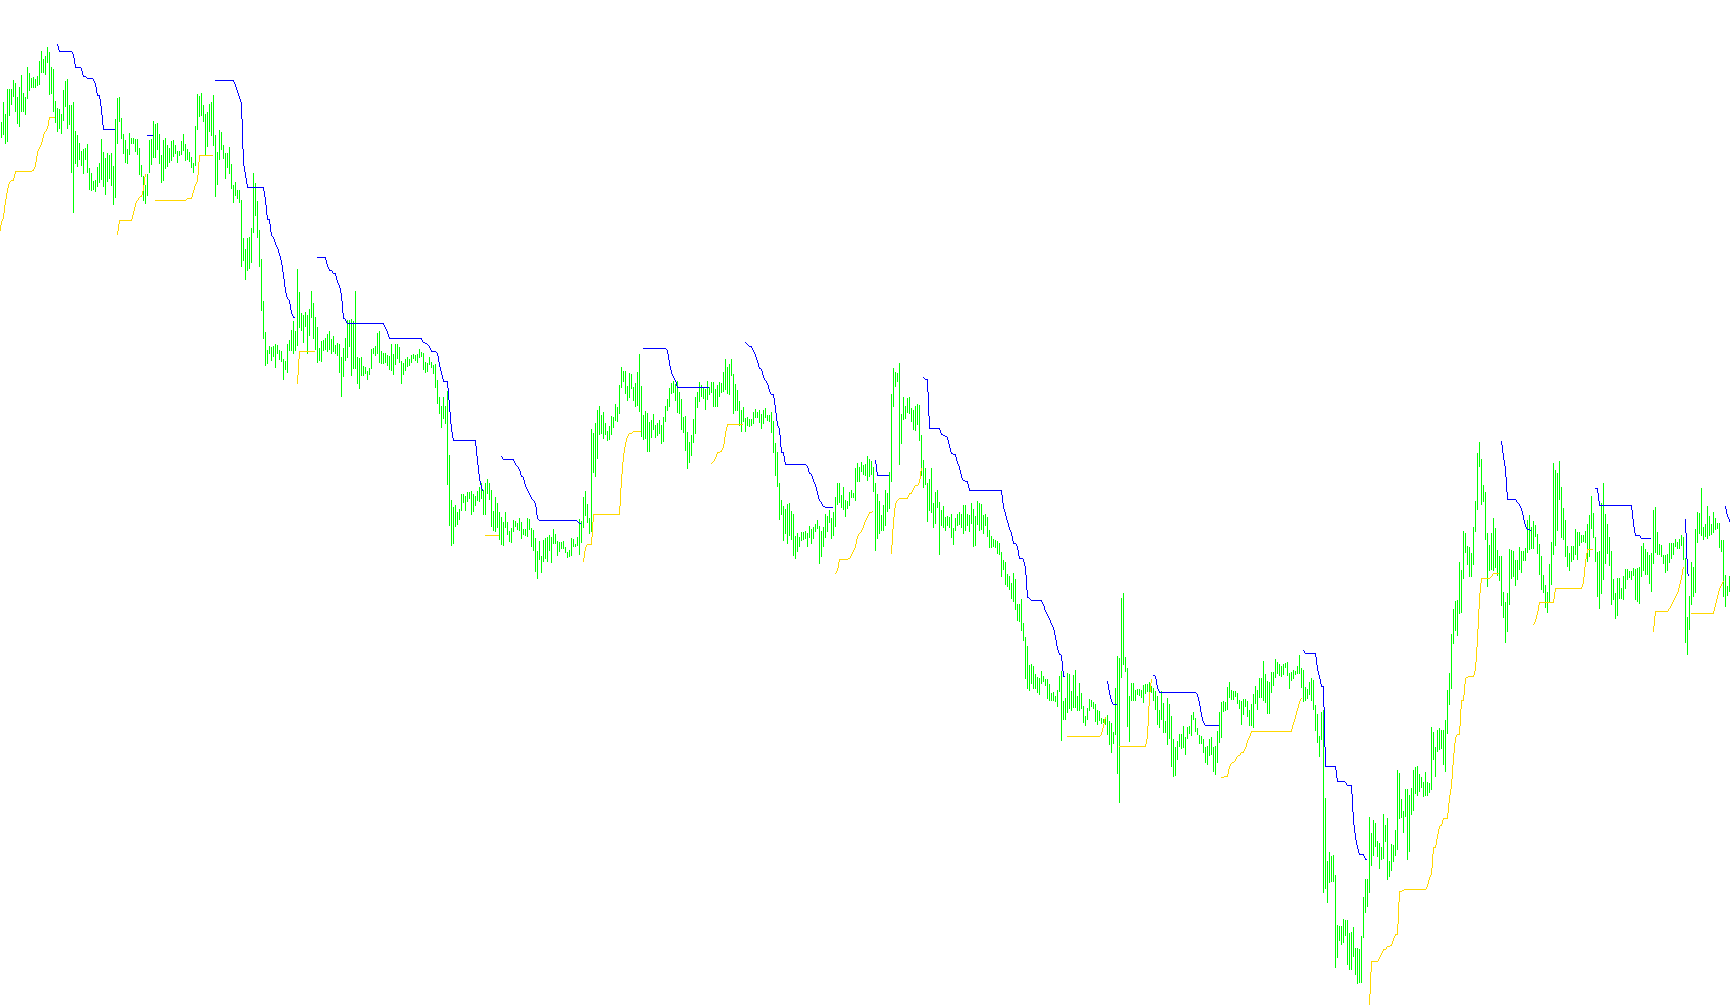
Chaikin
Indicator

Chaikin

iMAOnArrayiOBV

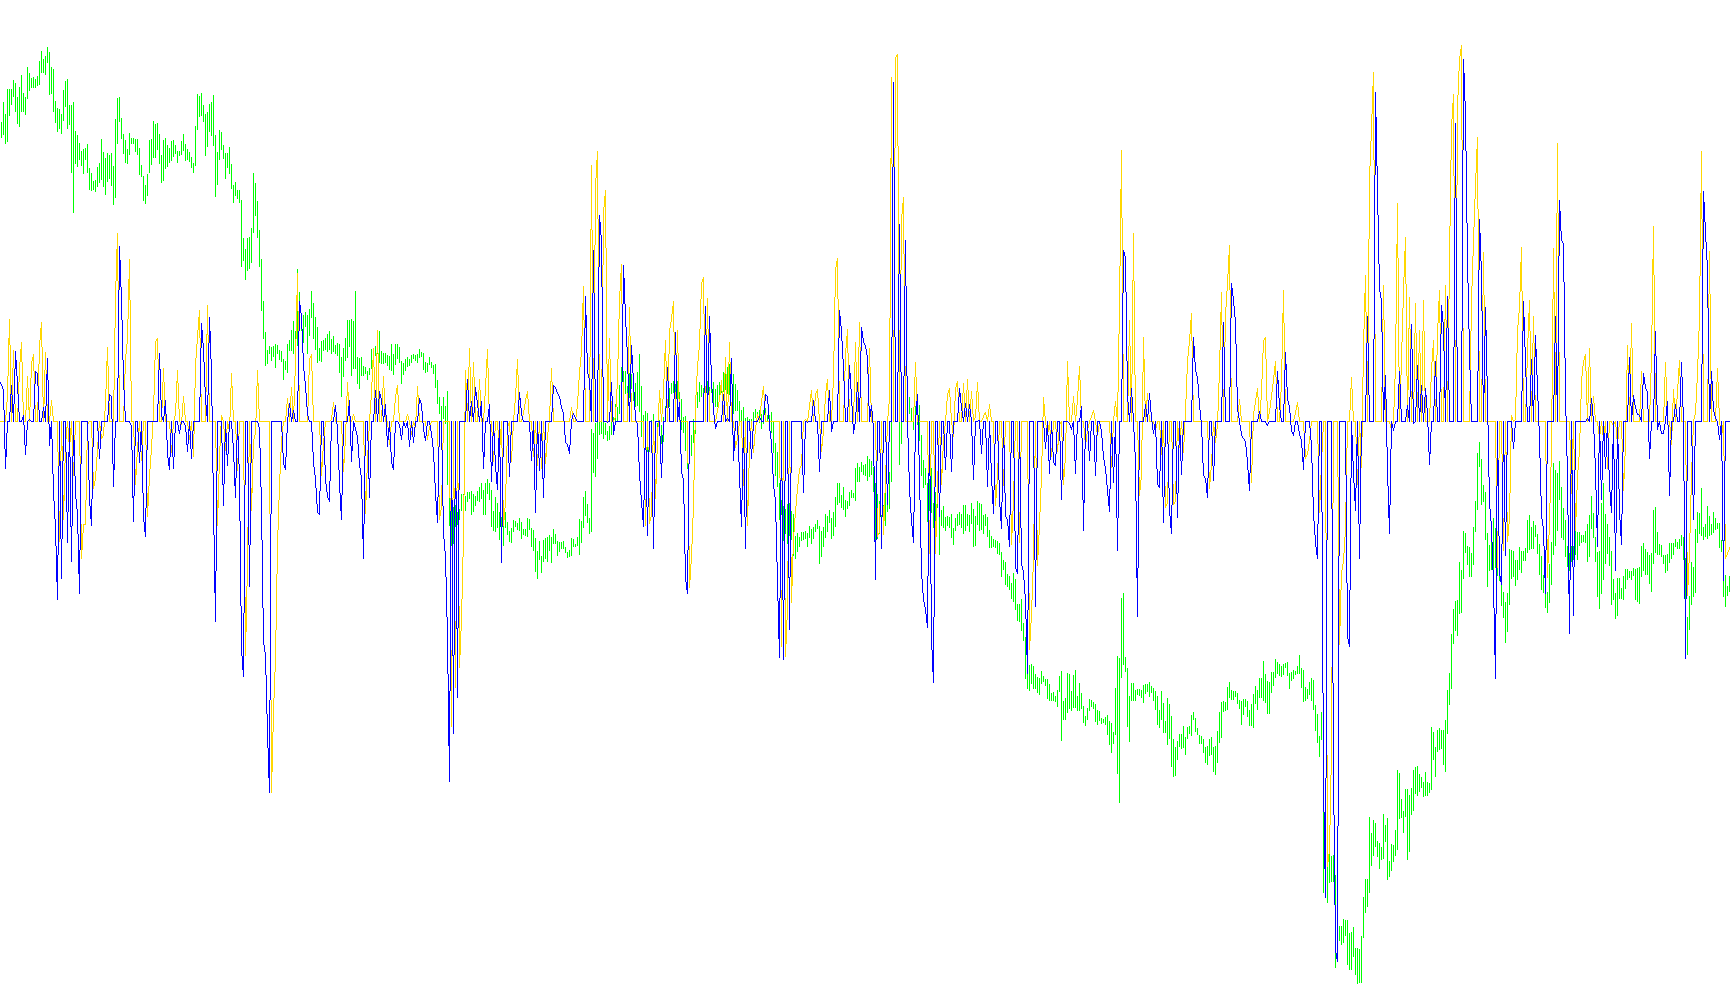
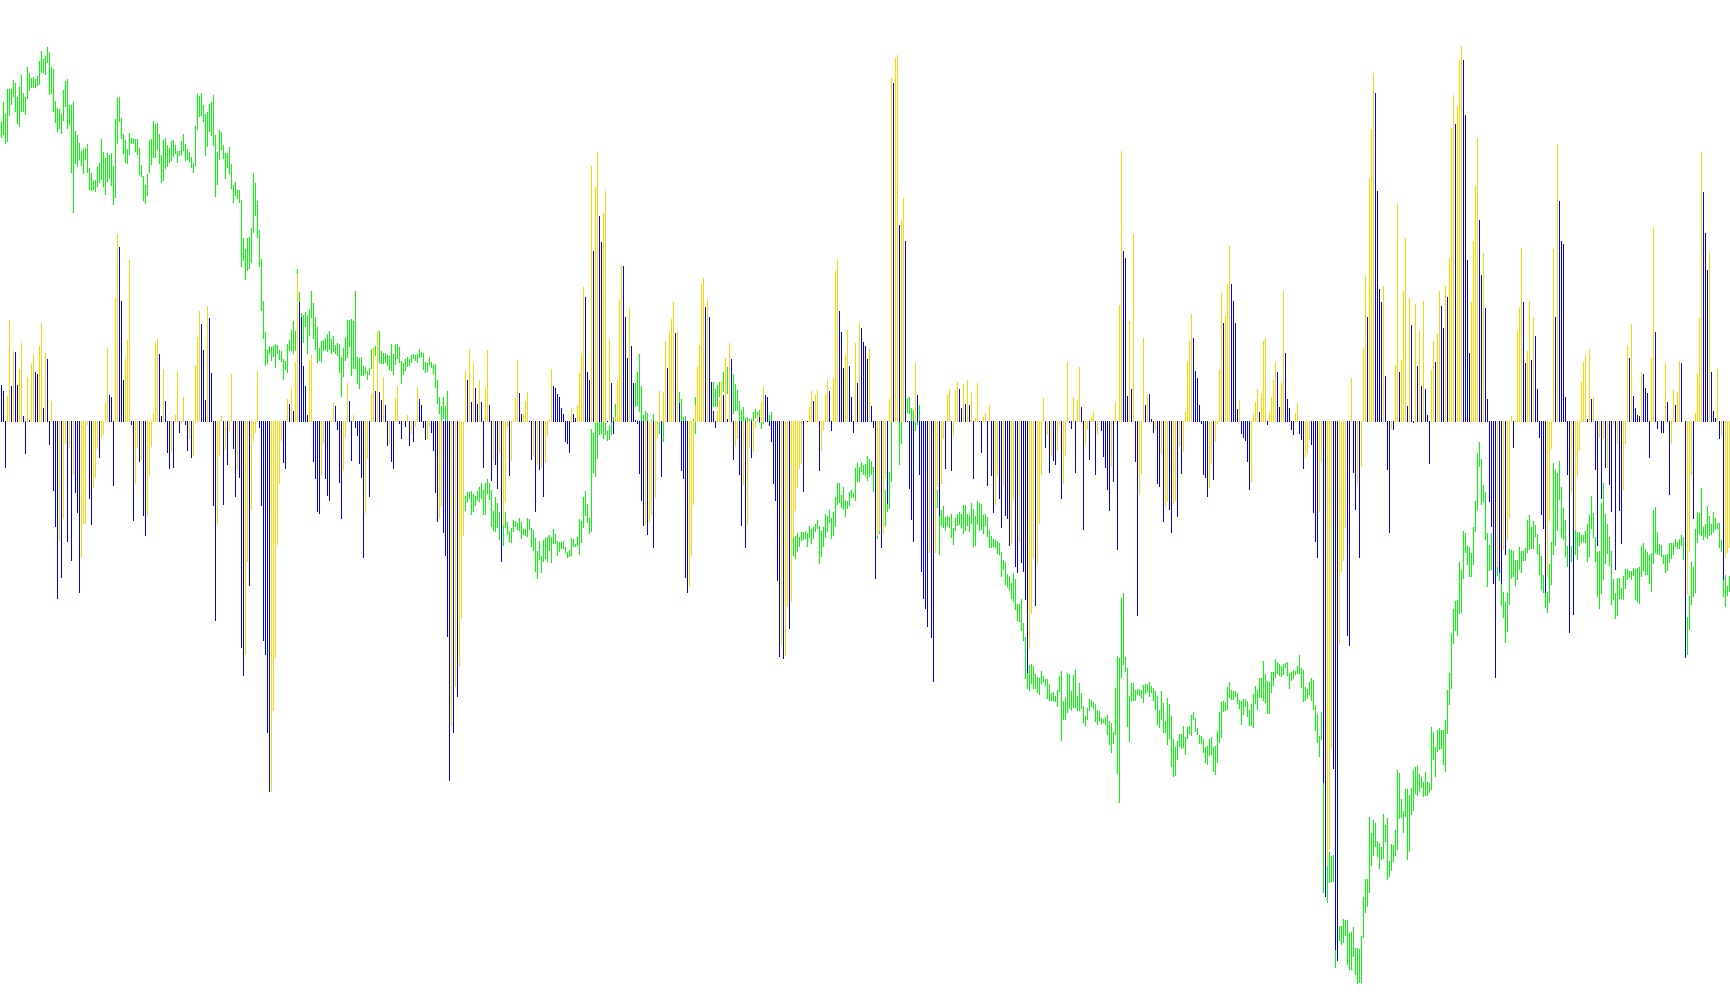
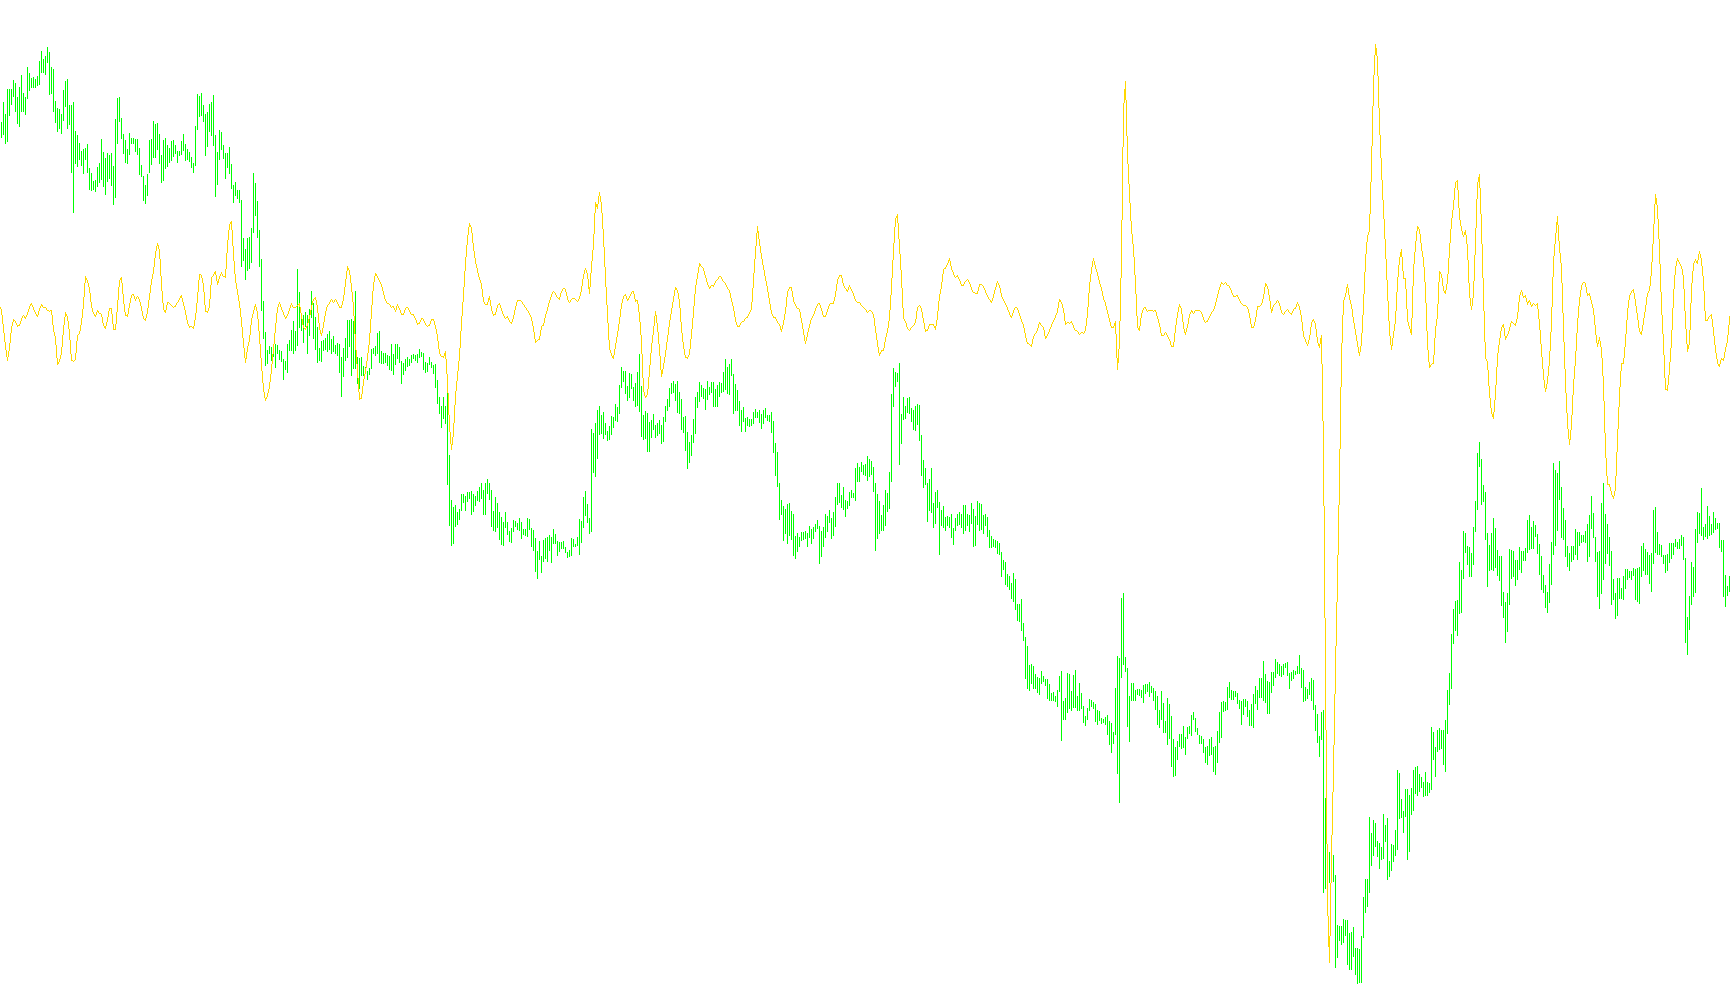
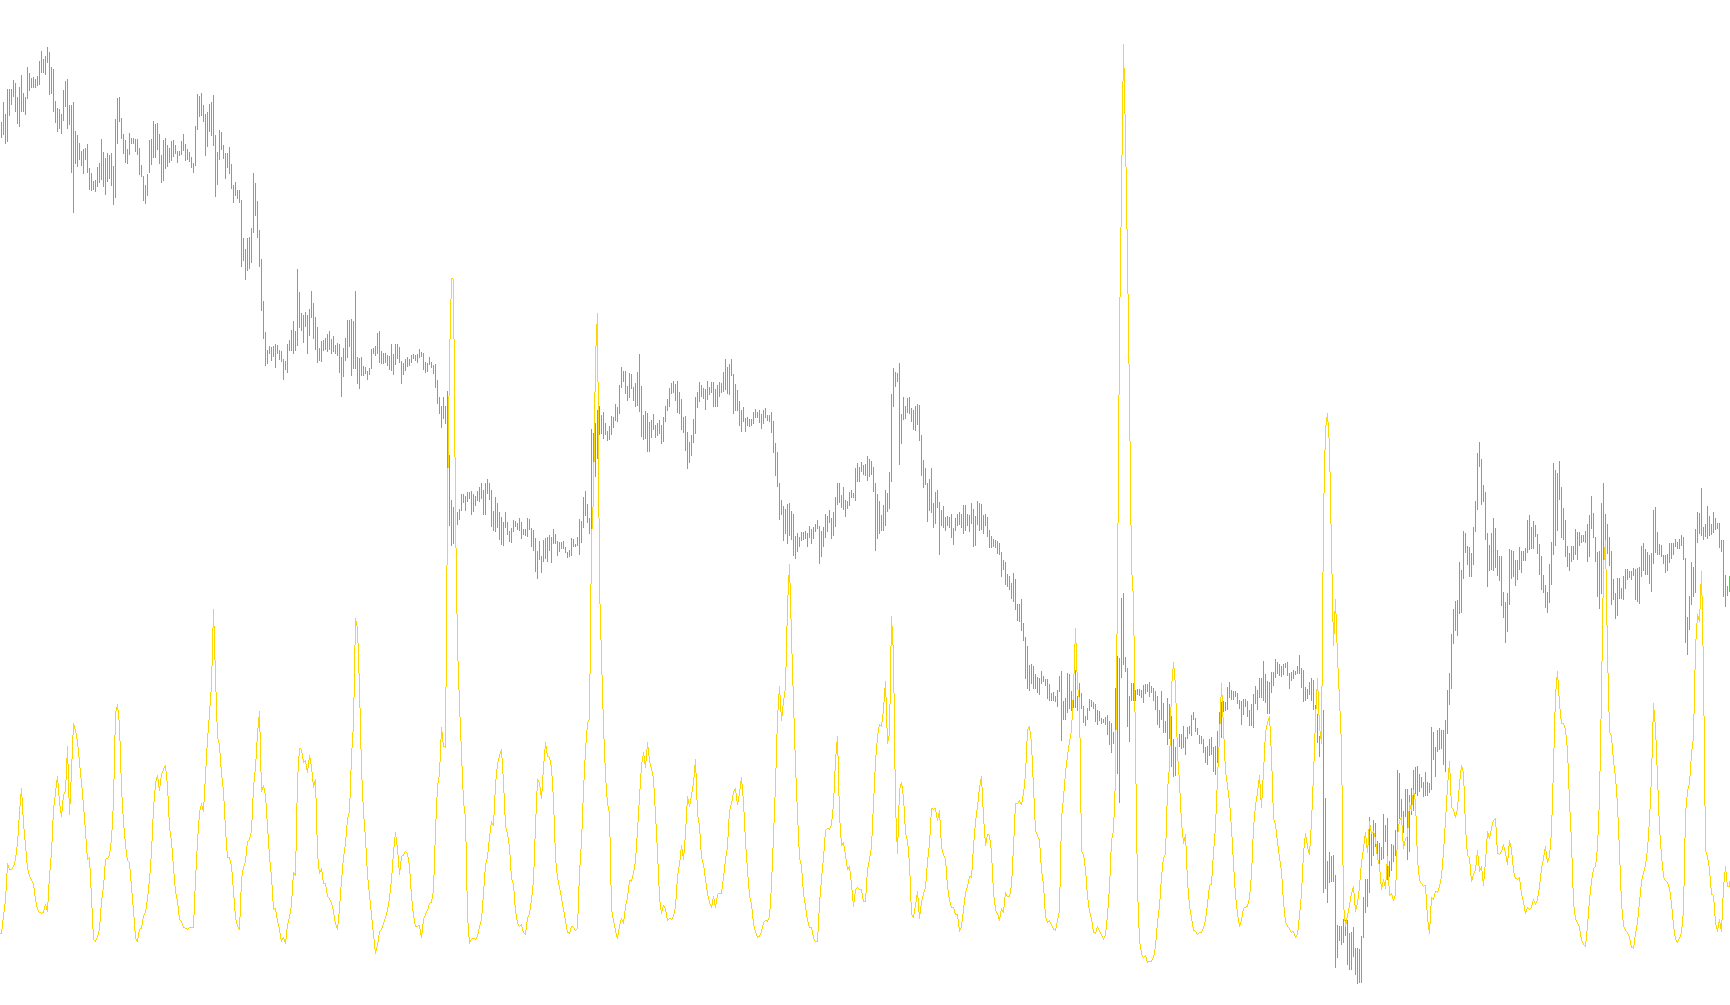
The algorithm calculates the distance between the raw On-Balance Volume and its long-term moving average to identify trend momentum.

ChandelierExit
Indicator

ChandelierExit

iATR

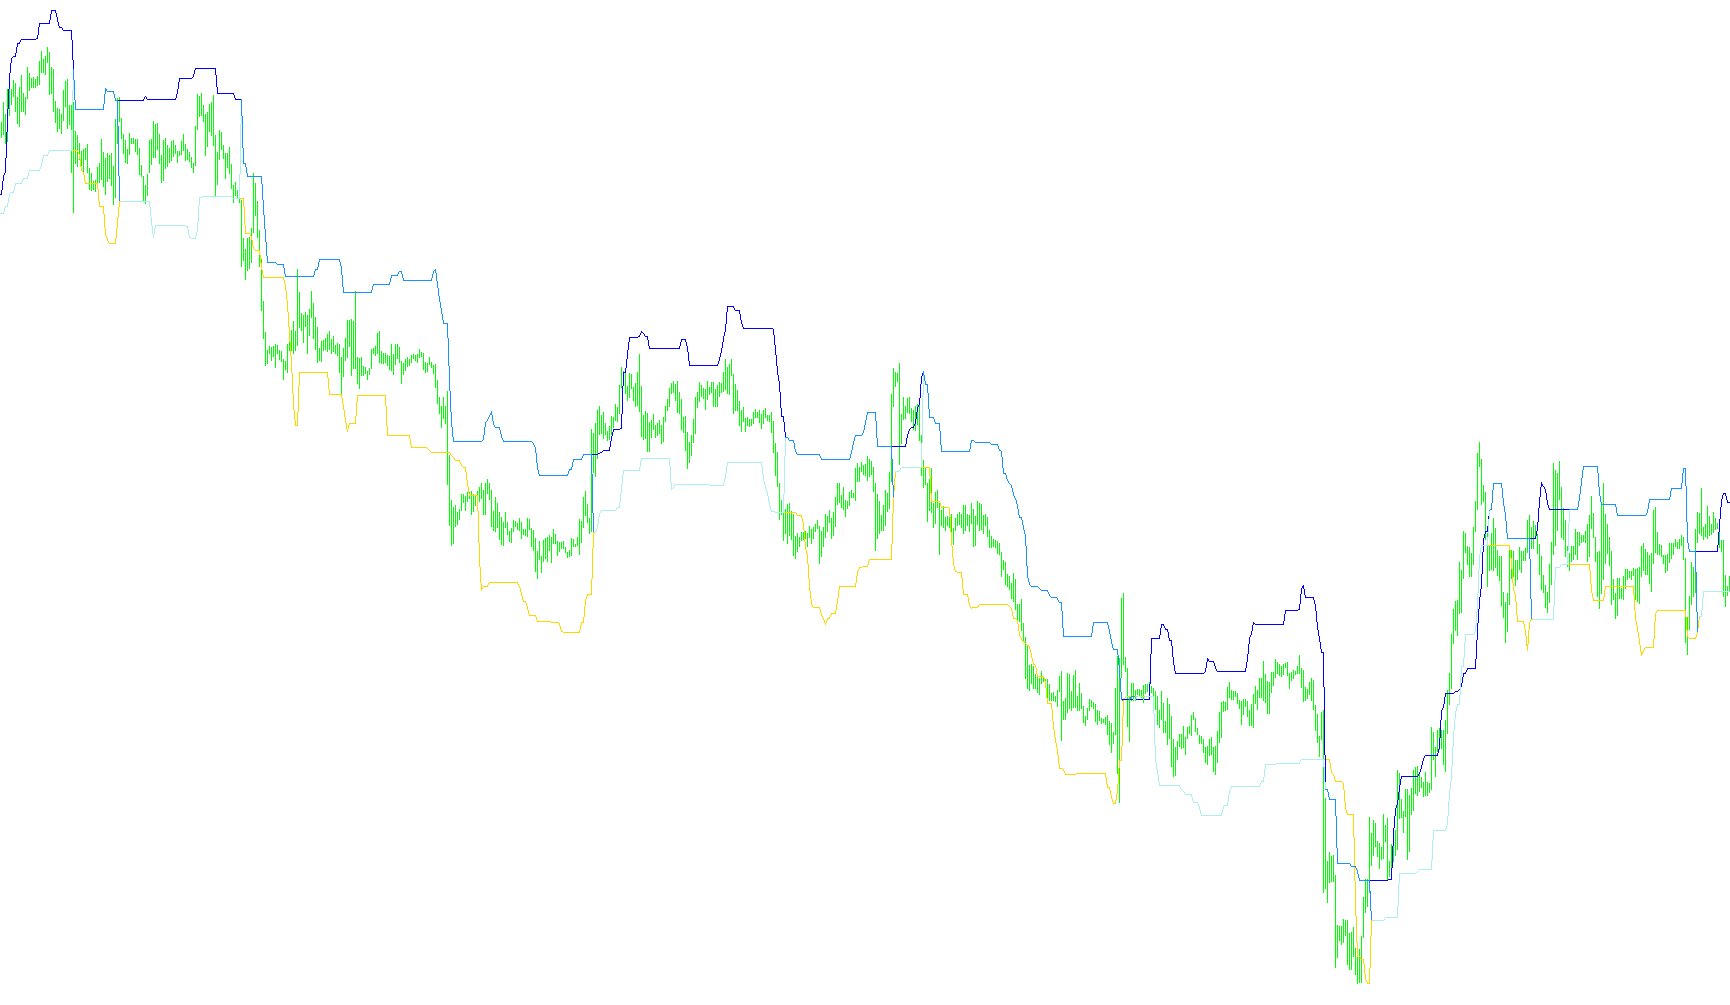
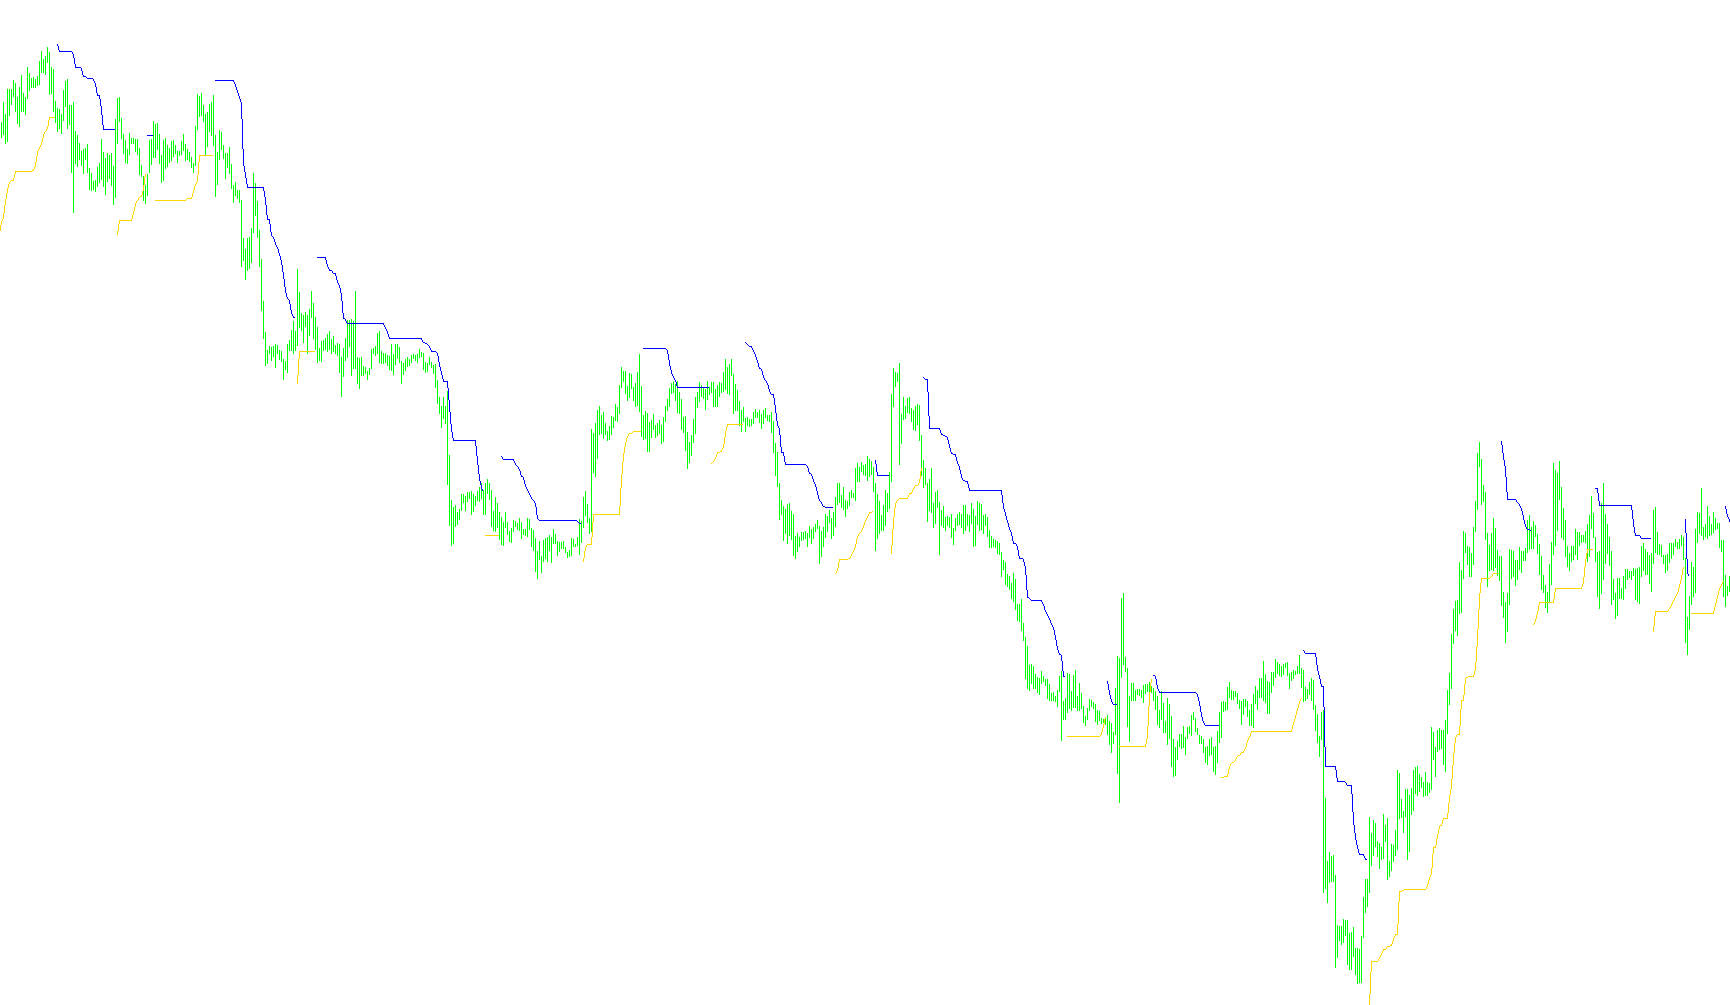
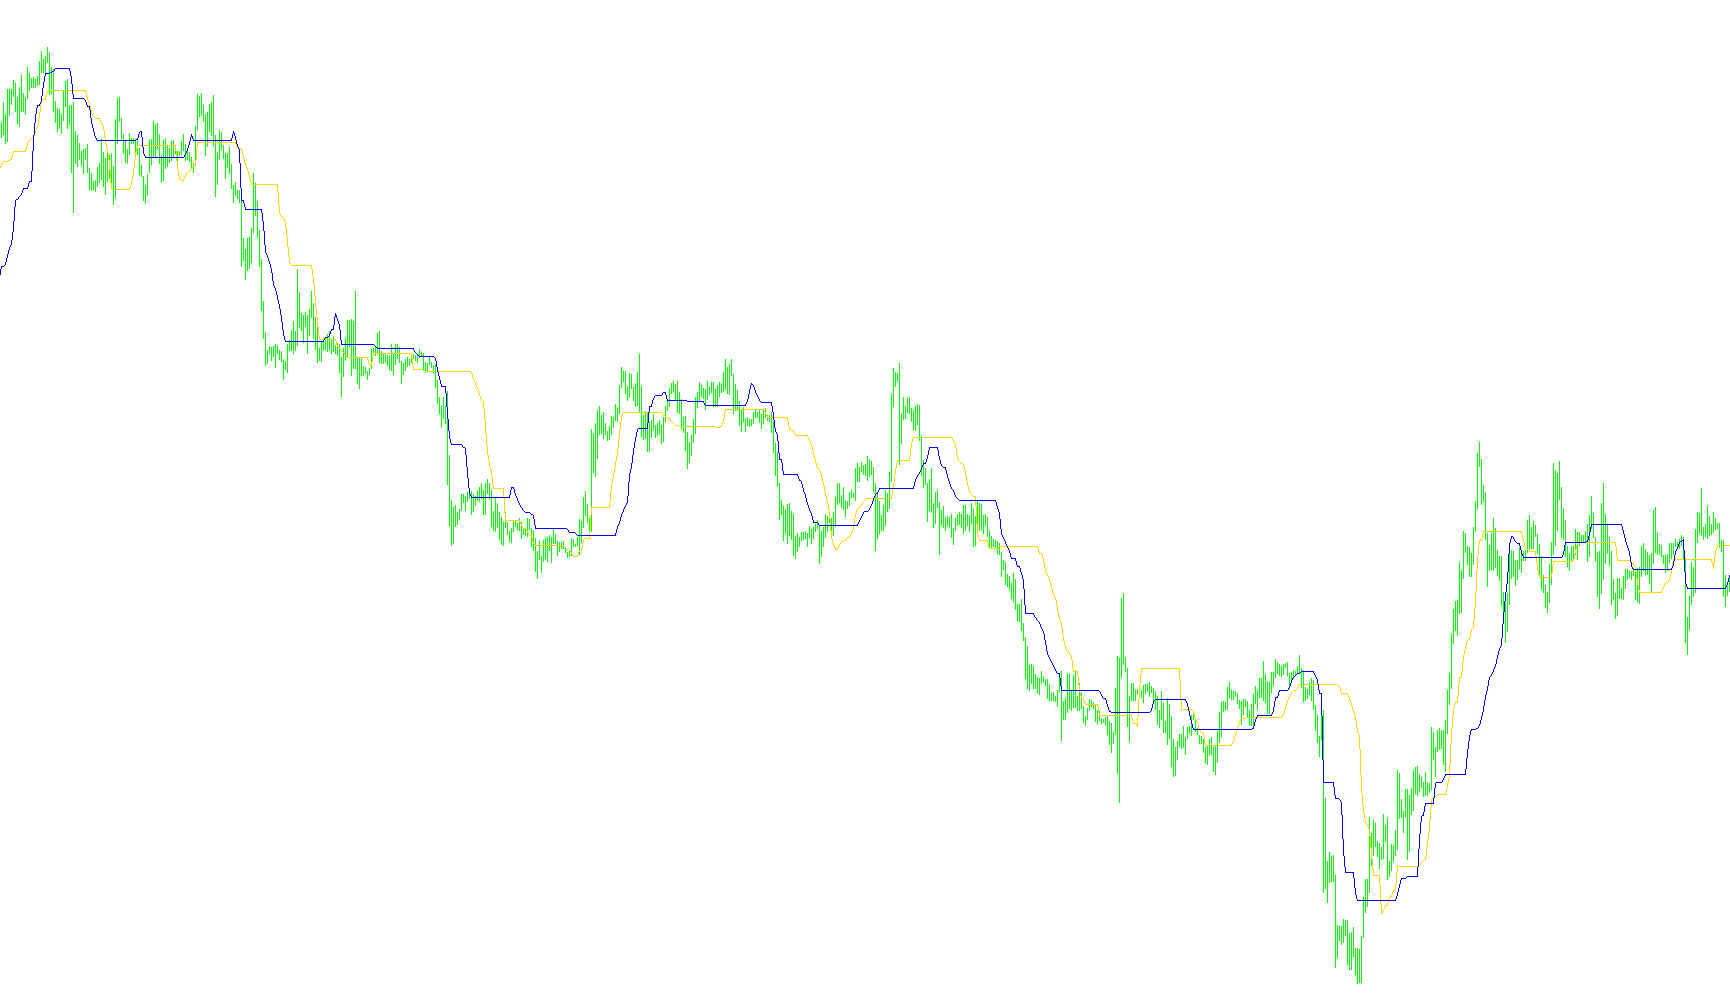
Identifies trend reversal points by calculating price deviation from rolling high-low extremes scaled by the Average True Range.

ChandelierExit_v1
Indicator

ChandelierExit_v1

iATR

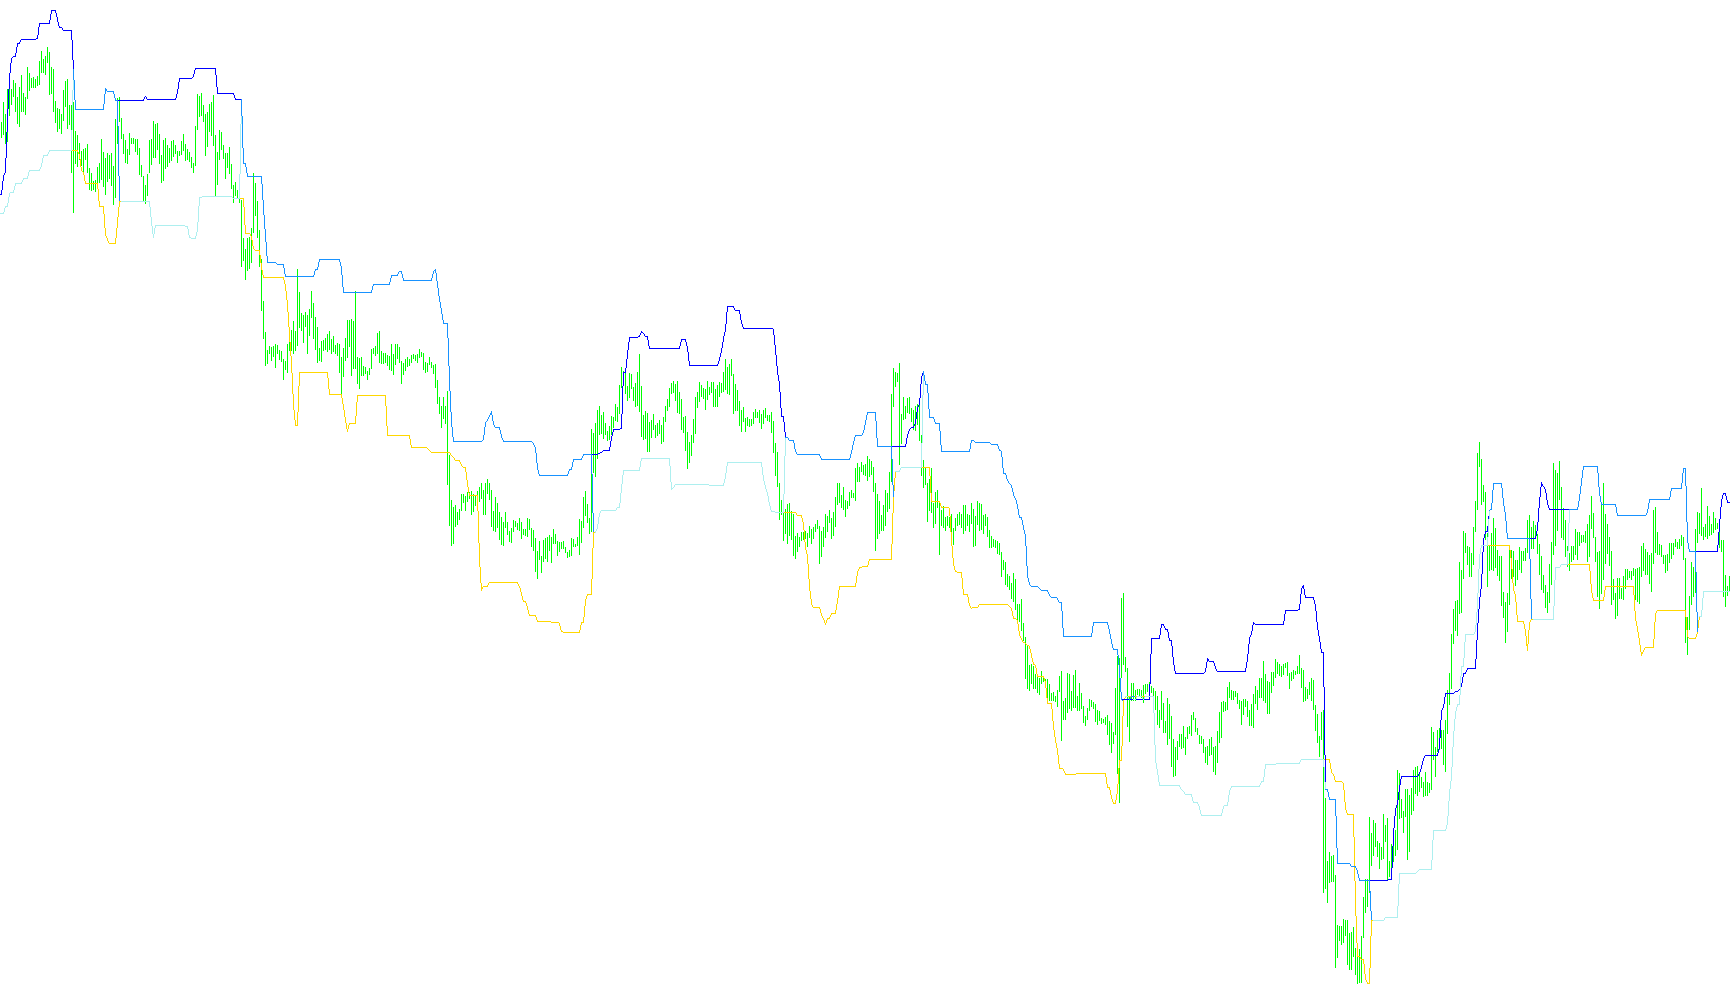
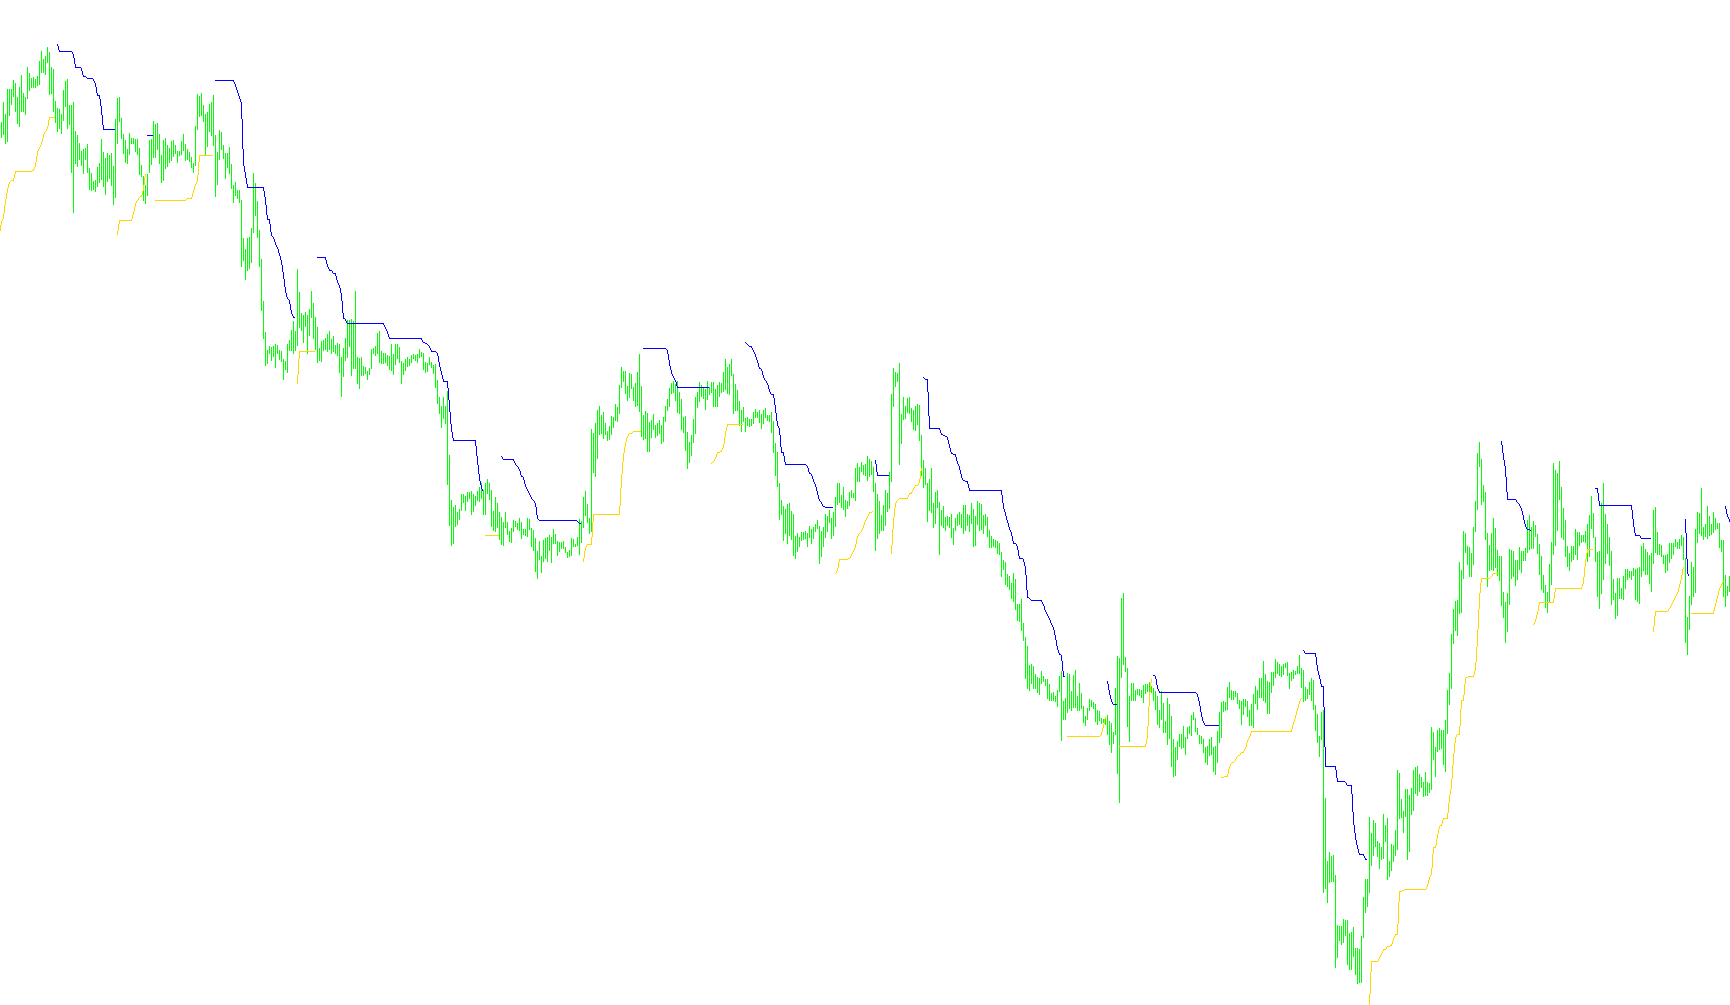
This indicator dynamically calculates trailing stop levels by merging high/low price extremes with ATR-based volatility multipliers to identify trend reversals.

ChandelierExit_v2
Indicator

ChandelierExit_v2

iATR

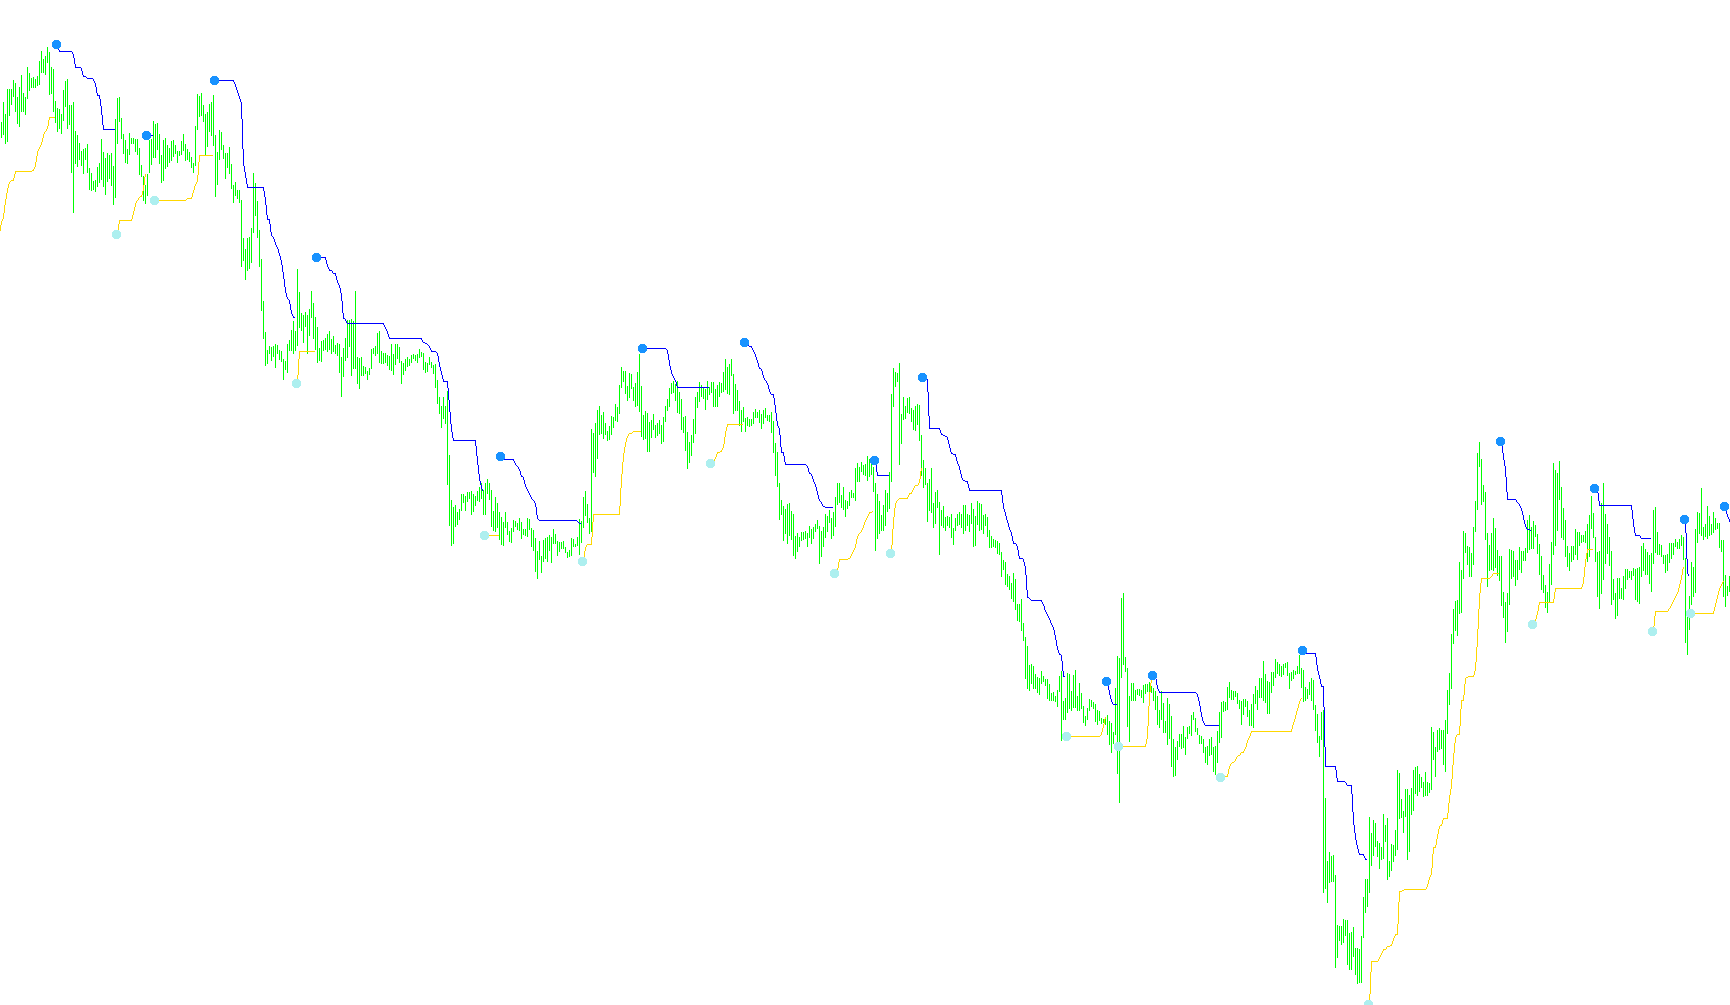
This indicator identifies trend reversals by calculating price exhaustion zones based on high/low extremes relative to a multiplied Average True Range.

ChandelierStops_v1.1
Indicator

ChandelierStops_v1.1

iATR

This indicator identifies market direction by calculating trailing support and resistance levels based on the highest highs, lowest lows, and Average True Range (ATR) volatility.

ChandelierStops_v1
Indicator

ChandelierStops_v1

iATR

This indicator identifies dynamic trend boundaries by calculating price extremes offset by a multiplier of the Average True Range to filter out market noise.

ChandelierStops_v1_v1
Indicator

ChandelierStops_v1_v1

iATR

This indicator dynamically calculates overhead and floor boundaries using Average True Range multipliers to identify trend reversals based on price penetration of volatility-adjusted extremes.

ChandelierStops_v1_v2
Indicator

ChandelierStops_v1_v2

iATR

This indicator identifies trend reversals by monitoring price breaches of dynamic boundaries calculated from the highest highs, lowest lows, and Average True Range multiplier.

ChandeQStik_v1
Indicator

ChandeQStik_v1

iMAOnArray

This indicator quantifies price action volatility by applying a moving average to the difference between closing and opening prices to identify directional trend shifts.

ChandeQStik_v1_001
Indicator

ChandeQStik_v1_001

iMAOnArray

This indicator calculates a moving average of the daily price range differences to visualize momentum direction and velocity through dual-colored histograms.

ChandeQStik_v1_002
Indicator

ChandeQStik_v1_002

iMAOnArray

This indicator calculates a moving average of the price action delta to visualize directional momentum shifts through distinct bullish and bearish histograms.

Chande_Kroll_Stop_v1
Indicator

Chande_Kroll_Stop_v1

iATR

This indicator identifies structural trend boundaries by calculating rolling extreme price levels offset by a multiplier of the Average True Range.

Chande_Kroll_Stop_v1_v1
Indicator

Chande_Kroll_Stop_v1_v1

iATR

This indicator identifies dynamic support and resistance levels by calculating the highest high and lowest low over a rolling period, offset by a multiplier of the Average True Range to account for market volatility.

ChangeObjectsColor
Indicator

ChangeObjectsColor

A specialized utility designed to automate visual style updates by batch-modifying the colors of specific geometric objects, labels, or substrings within the trading workspace.

Indicator

Change_of_Volatility

iMomentumiStdDevOnArray
Indicator

Channel

channels_v2.4
Indicator

channels_v2.4

This indicator identifies significant swing highs and lows across three different timeframes to project linear support, resistance, and equilibrium zones based on relative price velocity.

channels_v2.5
Indicator

channels_v2.5

This indicator identifies multi-period structural extremes and projects dynamic support and resistance zones based on calculated price expansion ratios.

channel_breakout_entry_basic
Indicator

channel_breakout_entry_basic

iATR

This indicator identifies momentum shifts by detecting price breaches of nested high/low channels and dynamically projects risk boundaries using ATR-based volatility offsets.

Channel_ZZ
Indicator

Channel_ZZ

iMA

This indicator identifies structural trend shifts by tracking extrapolated price extremes and projecting a parallel buffer zone based on volatility-sensitive geometric expansion.

Indicator

Chart1

Indicator

Chart2

Indicator

CHFJPY

CHF_CORR_EUR
Indicator

CHF_CORR_EUR

This indicator identifies aggressive price movements in the USD/CHF pair on a one-minute timeframe to generate contrarian buy and sell signals for EURUSD based on specific pip threshold breaches.

CHF_CORR_EUR[1]
Indicator

CHF_CORR_EUR[1]

This indicator triggers alerts by monitoring USDCHF price fluctuations relative to the opening price on a one-minute timeframe, identifying significant pips deviations to suggest counter-positioning on EURUSD.

CHF_CORR_EUR_v1
Indicator

CHF_CORR_EUR_v1

The indicator identifies specific price fluctuations in the USD/CHF pair to trigger directional buy and sell signals on the EUR/USD chart based on predefined pip thresholds.

CHF_CORR_EUR_v2
Indicator

CHF_CORR_EUR_v2

The indicator monitors the 1-minute price volatility of USDCHF to trigger automated alerts for EURUSD positions based on specific pip-threshold movements.

Indicator

Chin Breakout Alert V.1.1

Indicator

Chin Breakout Alert V.1.2s(m MTF)

Indicator

Chin Breakout Alert V.1.2s

Indicator

Chin Breakout Alert

chinkoucross
Indicator

chinkoucross

iIchimoku
Indicator

Chin_Breakout_Alert

Indicator

Chin_Breakout_Alert_V.1.2s

Indicator

Chin_Fib_All_in_One_Beta_2

CHO
Indicator

CHO

iADiMAOnArray
Indicator

Chris_example

CHV
Indicator

CHV

iMAOnArray

This indicator quantifies the percentage rate of change between smoothed price range extremes to identify accelerating volatility shifts.

Circles_for_fun
Indicator

Circles_for_fun

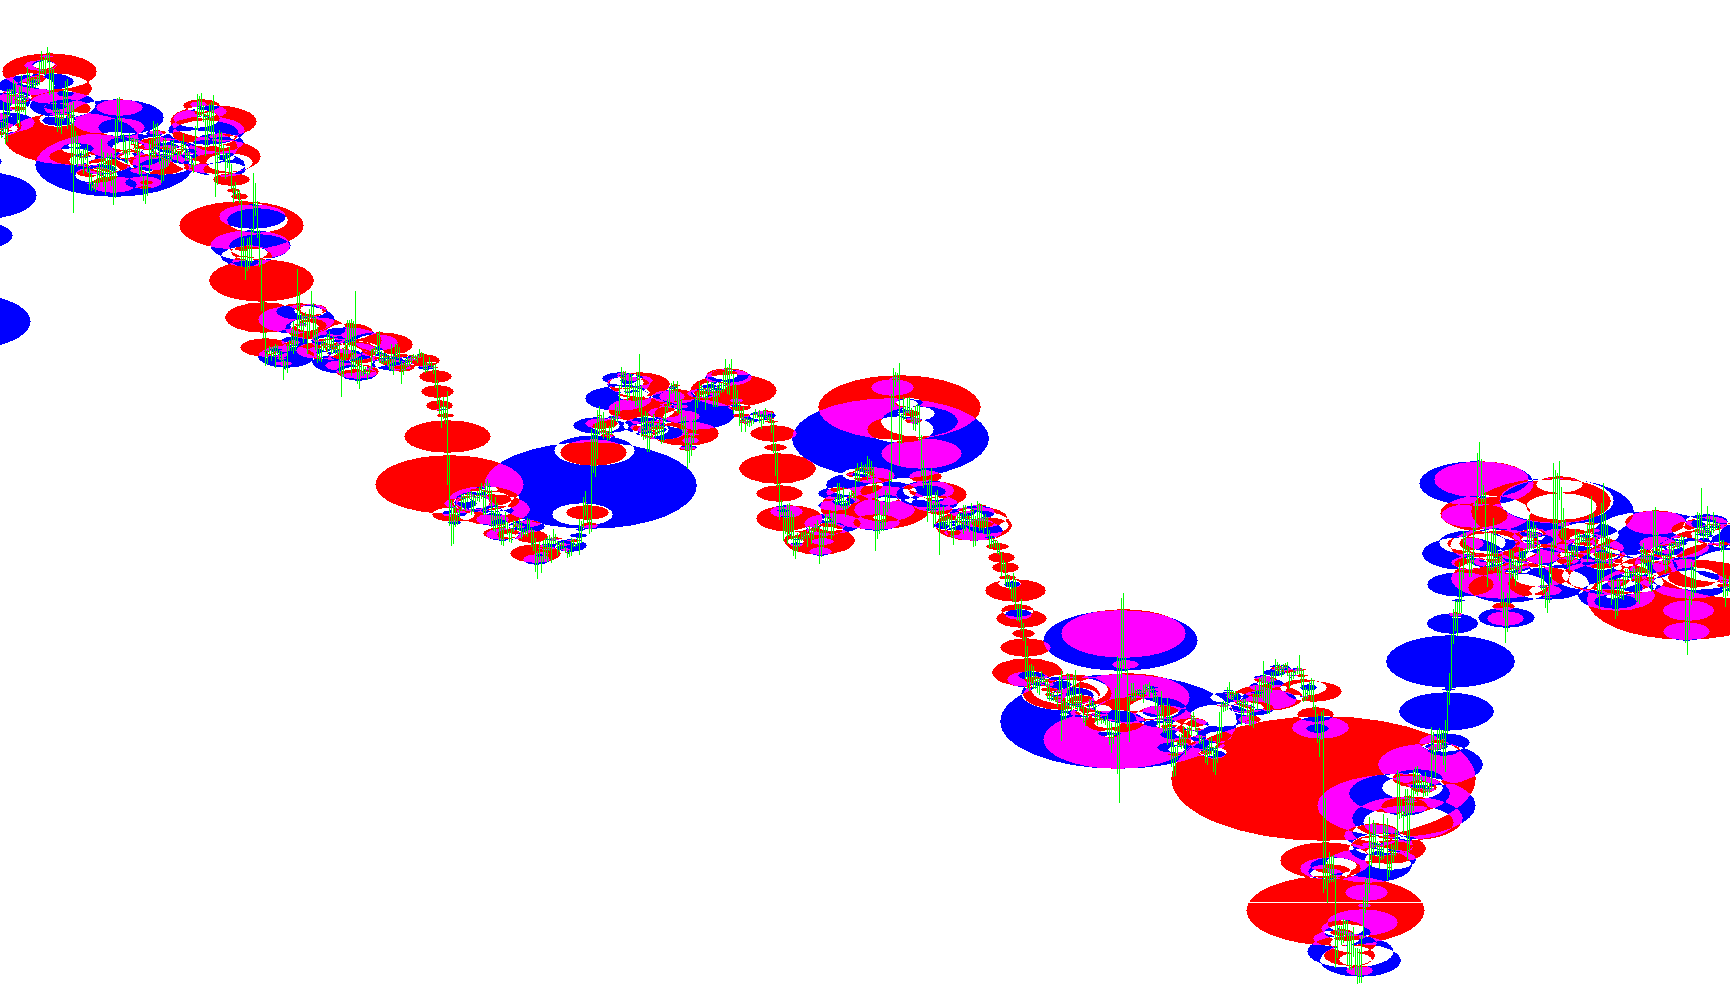
This indicator visually maps the price action of individual candles by rendering scaled elliptical shapes that change color based on bullish or bearish sentiment.
CK_Speed
Indicator

CK_Speed

iATRiRSIOnArrayiStdDev

This indicator identifies market regime shifts by evaluating the RSI of both Average True Range and Standard Deviation relative to a central equilibrium threshold.

Class1
Indicator

Class1

This script executes a nested quintuple loop to generate and export every possible numerical combination of five indices paired with specific currency pairs into a delimited CSV file.

Class2
Indicator

Class2

The script executes a five-level nested loop to systematically generate and export all possible coordinate combinations for a specific set of currency pairs into a CSV file.

Class3
Indicator

Class3

The script executes a nested combinatorial iteration across multiple currency pairs to identify and log specific balanced or near-parity buy/sell weight distributions.

Class4
Indicator

Class4

This script exhaustively iterates through nested permutations of binary outcomes across multiple currency pairs to identify and log specific balanced or near-balanced buy-sell distributions.

Class4_AUDUSD_buy
Indicator

Class4_AUDUSD_buy

The script executes a nested brute-force iteration to identify and export specific buy/sell equilibrium states across five currency pairs into a structured CSV log.

Class4_AUDUSD_not
Indicator

Class4_AUDUSD_not

The script exhaustively iterates through binary combinations of currency pair directions to identify and log balanced buy-sell distributions.

Class4_AUDUSD_sell
Indicator

Class4_AUDUSD_sell

The script exhaustively iterates through nested binary combinations of five currency pairs to identify and log specific buy-sell equilibrium states.

Class4_EURCHF_buy
Indicator

Class4_EURCHF_buy

This script systematically iterates through a nested permutation of five currency pairs to identify and export balanced long-short configurations into a delimited text file.

Class4_EURCHF_not
Indicator

Class4_EURCHF_not

The script iterates through a five-dimensional nested loop to identify and log specific balanced buy-sell distributions across multiple currency pairs.

Class4_EURCHF_sell
Indicator

Class4_EURCHF_sell

This script performs an exhaustive brute-force iteration across five currency pairs to identify specific balanced buy-to-sell ratios and export the resulting permutations into a CSV log.