ColorRSI_Histo_ZeroLine1
Download script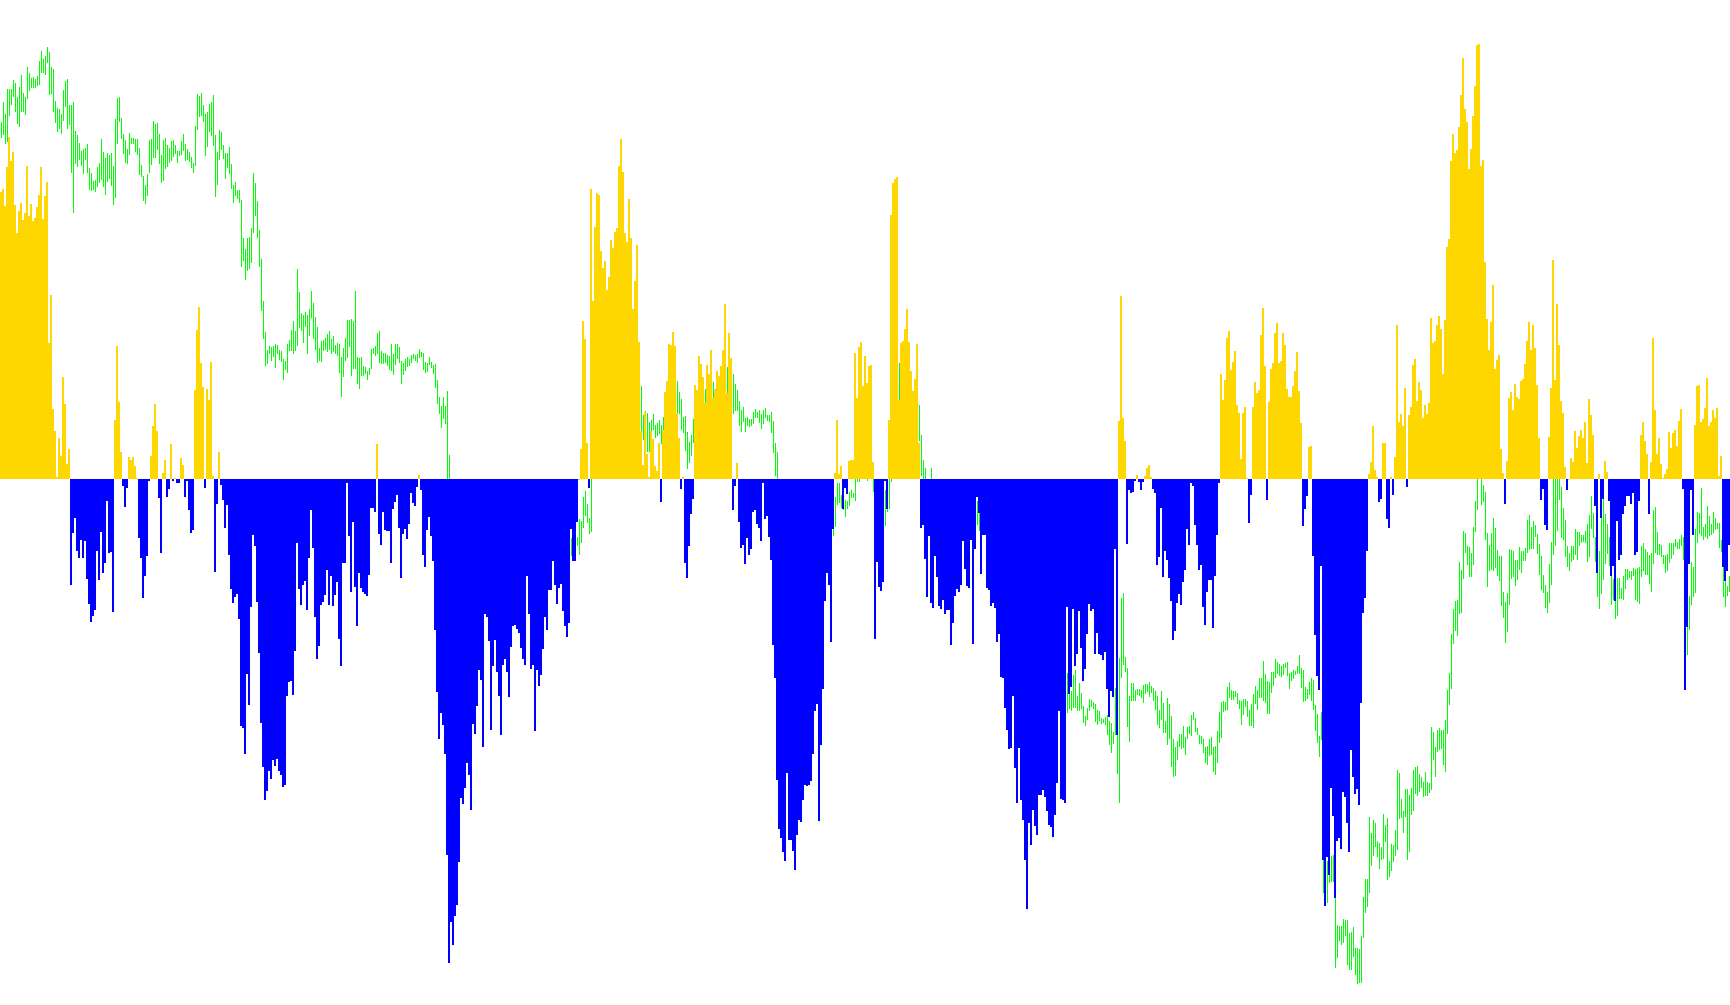
This custom indicator is designed to provide a visual representation of market momentum by modifying the standard Relative Strength Index (RSI). Instead of showing a typical oscillating line, it translates the RSI data into a vertical histogram that centers around a zero-point baseline, making it easier to identify bullish and bearish trends at a glance.
Core Logic and Functionality
The tool operates by calculating the RSI based on a user-defined period (defaulting to 21) and comparing the resulting value against a fixed midpoint of 50. Here is how the logic flows:
- Baseline Comparison: The script constantly monitors the "strength" of the price movement. It uses the number 50 as its primary pivot point to determine whether the current market sentiment is leaning toward strength or weakness.
- Dynamic Positioning: When the RSI value exceeds the midpoint of 50, the indicator treats this as an upward momentum signal. It calculates the distance between the RSI and that midpoint and plots it as a positive histogram bar.
- Opposing Sentiment: Conversely, when the RSI falls below the 50 midpoint, the tool identifies this as downward momentum. It captures the difference between the RSI and the midpoint and reflects it as a negative histogram bar on the opposite side of the zero line.
Visual Representation
The primary goal of this logic is to provide high-contrast visual feedback for traders:
- Histogram Style: Rather than a continuous line, the data is displayed as solid bars (histograms). This allows for a clearer view of the "weight" or magnitude of the momentum at any specific moment in time.
- Color Coding: The indicator uses two distinct colors—Green and Red—to separate these movements. This creates an immediate visual distinction between periods where the market is showing upward strength versus downward pressure.
- Zero-Line Symmetry: By centering the data around a zero line, the tool allows users to see how far the price momentum has stretched away from the "neutral" 50-point RSI mark, helping to identify potential overextended moves or shifts in trend direction.
Summary for Users
In simple terms, this script takes the standard RSI indicator and "flips" it into a balanced histogram. It tells you not just if the market is strong or weak, but visually displays the intensity of that strength above or below a neutral center line, using color to make those transitions instantly recognizable.
/*-----------------------------+
|			       |
| Shared by www.Aptrafx.com    |
|			       |
+------------------------------*/

//+------------------------------------------------------------------+
//|                                      ColorRSI_Histo_ZeroLine.mq4 |
//|                Copyright © 2006 , David W Honeywell , 12/12/2006 |
//|                                     HellOnWheels.Trans@gmail.com |
//+------------------------------------------------------------------+
#property copyright "Copyright © 2006 , David W Honeywell , 12/12/2006"
#property link      "HellOnWheels.Trans@gmail.com"

#property indicator_separate_window

#property indicator_buffers 2

#property indicator_color1 Green
#property indicator_color2 Red

#property indicator_maximum  50.0
#property indicator_minimum -50.0

#property indicator_level1  10
#property indicator_level2 0.0
#property indicator_level3 -10

extern int IndicatorTime =  0;
extern int RSI_Periods   = 21;
extern int Applied_Price =  0;
extern int LineWidth     =  3;

double Buffer0[];
double Buffer1[];

//+------------------------------------------------------------------+
//| Custom indicator initialization function                         |
//+------------------------------------------------------------------+
int init()
 {
//---- indicators

IndicatorBuffers(2);

SetIndexStyle(0,DRAW_HISTOGRAM,STYLE_SOLID,LineWidth);
SetIndexEmptyValue(0,0.0);
SetIndexBuffer(0,Buffer0);

SetIndexStyle(1,DRAW_HISTOGRAM,STYLE_SOLID,LineWidth);
SetIndexEmptyValue(1,0.0);
SetIndexBuffer(1,Buffer1);

IndicatorShortName(" ColorRSI_Histo_ZeroLine ( "+RSI_Periods+" ) ");

//----
  return(0);
 }
//+------------------------------------------------------------------+
//| Custom indicator deinitialization function                       |
//+------------------------------------------------------------------+
int deinit()
 {
//----

//----
  return(0);
 }
//+------------------------------------------------------------------+
//| Custom indicator iteration function                              |
//+------------------------------------------------------------------+
int start()
 {
  int     counted_bars=IndicatorCounted();
  //double  StaticValue, RSIValue, Finish;
  int     i;
  int     limit;

  limit = Bars-counted_bars;
  for(i=0; i<limit; i++)
  {
     double StaticValue = 50.00000000;
     double RSIValue = iRSI(Symbol(),IndicatorTime,RSI_Periods,Applied_Price,i);
     double Finish = (StaticValue - RSIValue)*(-1);

     if (RSIValue > StaticValue)
     {
        Buffer0[i] = Finish;
        Buffer1[i] = 0.00000000;
     }
     if (RSIValue < StaticValue)
     {
        Buffer0[i] = 0.00000000;
        Buffer1[i] = Finish;
     }
  }

//----
  return(0);
 }
//+------------------------------------------------------------------+
Comments