CoeffoLine_Hist_v2
Download script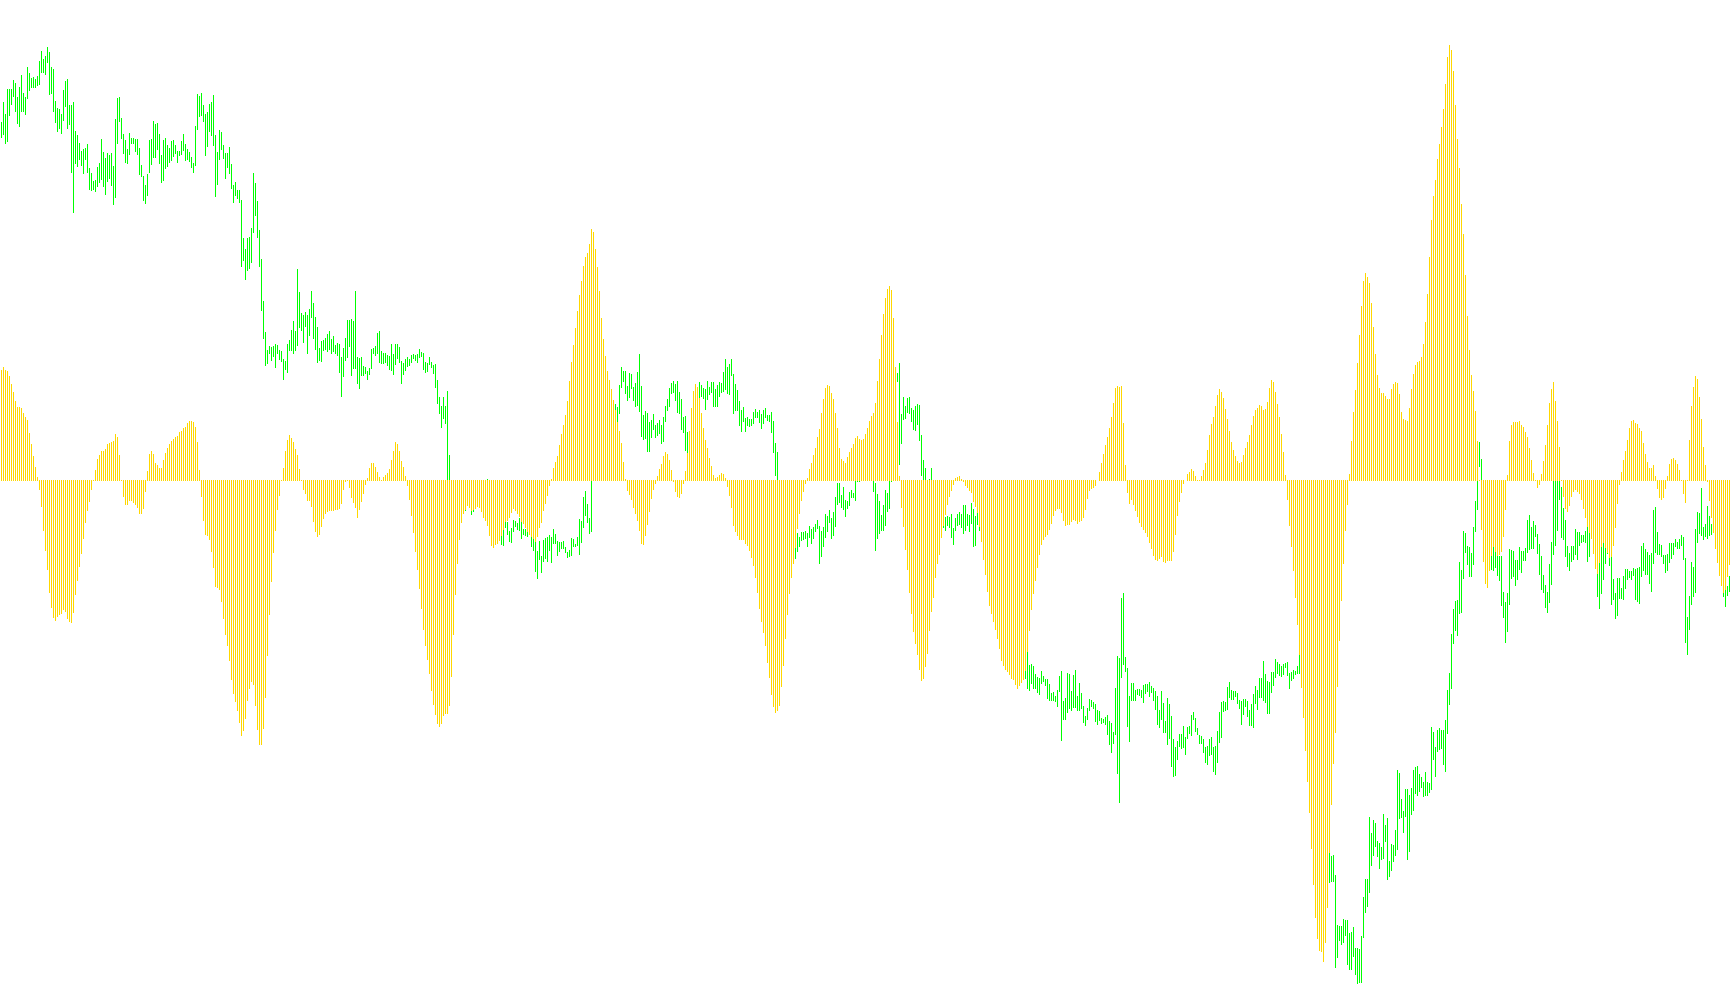
This technical indicator is designed to provide a visual representation of market trends by analyzing the relationship between price action and moving averages. Rather than simply showing where the price is, it calculates a mathematical "coefficient" that highlights the momentum and relative strength of the current market movement.
Core Logic and Methodology
The script operates by comparing two distinct types of data: raw price averages and smoothed technical indicators. Here is how the process works behind the scenes:
- Data Aggregation: The tool looks back at a specific number of historical bars (defined by the user) to establish a baseline. It identifies the midpoint of each bar—the average between the high and low prices—and uses this to calculate a weighted sum of recent price activity.
- Dual Comparison Analysis: The logic performs two separate calculations simultaneously. One side focuses on the raw price movements, while the other focuses on a smoothed "Median Moving Average." By comparing these two different types of data against each other, the tool can detect subtle shifts in market sentiment that might not be visible to the naked eye.
- Weighting System: To ensure the most recent market information carries more significance than older data, the script applies a specific weighting formula. This ensures that the "current" trend is given priority in the calculation while still respecting the broader context of historical price action.
- Logarithmic Transformation: Once the relationship between the price movement and the moving average is established, the tool converts this value into a logarithmic scale. This helps to smooth out extreme spikes and provides a more readable "coefficient."
Visual Representation
The result of these calculations is displayed as a histogram in a separate window.
- Trend Identification: The indicator identifies whether the price is moving faster or slower than its historical average.
- Currency Adjustment: The logic includes a built-in filter that automatically detects specific major currency pairs (such as EURUSD, GBPUSD, etc.). Depending on the pair being traded, it adjusts the polarity of the calculation to ensure the histogram reflects the market direction accurately for that specific asset.
In summary, this tool acts as a momentum oscillator. It filters out "noise" by comparing weighted price averages against smoothed indicators, providing the user with a visual coefficient that represents the intensity and direction of the current trend.
/*-----------------------------+
|			       |
| Shared by www.Aptrafx.com    |
|			       |
+------------------------------*/

//+------------------------------------------------------------------+
//| CoeffoLine_Hist.mq4
//| Ramdass - Conversion only
//+------------------------------------------------------------------+

#property indicator_separate_window
#property indicator_buffers 1
#property indicator_color1 Red


extern int ndot=30;
extern int CountBars=10000;
//---- buffers
double cfl[];


//+------------------------------------------------------------------+
//| Custom indicator initialization function                         |
//+------------------------------------------------------------------+
int init()
  {
   string short_name;
//---- indicator line
   IndicatorBuffers(1);
   SetIndexStyle(0,DRAW_HISTOGRAM);
   SetIndexBuffer(0,cfl);
//----
   return(0);
  }
//+------------------------------------------------------------------+
//| CoeffofLine_v1                                                              |
//+------------------------------------------------------------------+
int start()
  {


   if (CountBars>=Bars) CountBars=Bars;
   SetIndexDrawBegin(0,Bars-CountBars+ndot+1);
   int i,shift,cnt,ndot1,counted_bars=IndicatorCounted();
   double TYVar,ZYVar,TIndicatorVar,ZIndicatorVar,M,N,AY,AIndicator;
//----
   if(Bars<=ndot) return(0);

//----
   shift=CountBars-ndot-1;


   while(shift>=0)
     {

   TYVar=0;
	ZYVar=0;
	N=0;
	M=0;
	TIndicatorVar=0;
	ZIndicatorVar=0;
	ndot1=ndot;
	if (shift+1<ndot1) ndot1=shift+1;
	for (cnt=ndot; cnt>=1; cnt--) // n=5 -  ïî ïÿòè òî÷êàì
	{
		N=N+cnt*cnt;  //ðàâíî 55
		M=M+cnt;      //ðàâíî 15
	}
	for (cnt=ndot1; cnt>=1; cnt--) // n=5 -  ïî ïÿòè òî÷êàì
	{
		ZYVar=ZYVar+(High[shift-cnt+1]+Low[shift-cnt+1])/2*(ndot+1-cnt);
		TYVar=TYVar+(High[shift-cnt+1]+Low[shift-cnt+1])/2;
		ZIndicatorVar=ZIndicatorVar+iMA(NULL,0,5,3,MODE_SMMA,PRICE_MEDIAN,shift-cnt+1)*(ndot+1-cnt);
		TIndicatorVar=TIndicatorVar+iMA(NULL,0,5,3,MODE_SMMA,PRICE_MEDIAN,shift-cnt+1);
	}
	AY=(TYVar+(N-2*ZYVar)*ndot/M)/M;
	AIndicator=(TIndicatorVar+(N-2*ZIndicatorVar)*ndot/M)/M;
	if (Symbol()=="EURUSD" || Symbol()=="GBPUSD" || Symbol()=="USDCAD" || Symbol()=="USDCHF"
	 || Symbol()=="EURGBP" || Symbol()=="EURCHF" || Symbol()=="AUDUSD"
	 || Symbol()=="GBPCHF")
	{cfl[shift]=(-1000)*MathLog(AY/AIndicator);}
	else {cfl[shift]=(1000)*MathLog(AY/AIndicator);}


      shift--;
     }
   return(0);
  }
//+------------------------------------------------------------------+
Comments