CoeffoLine_Hist1
Download script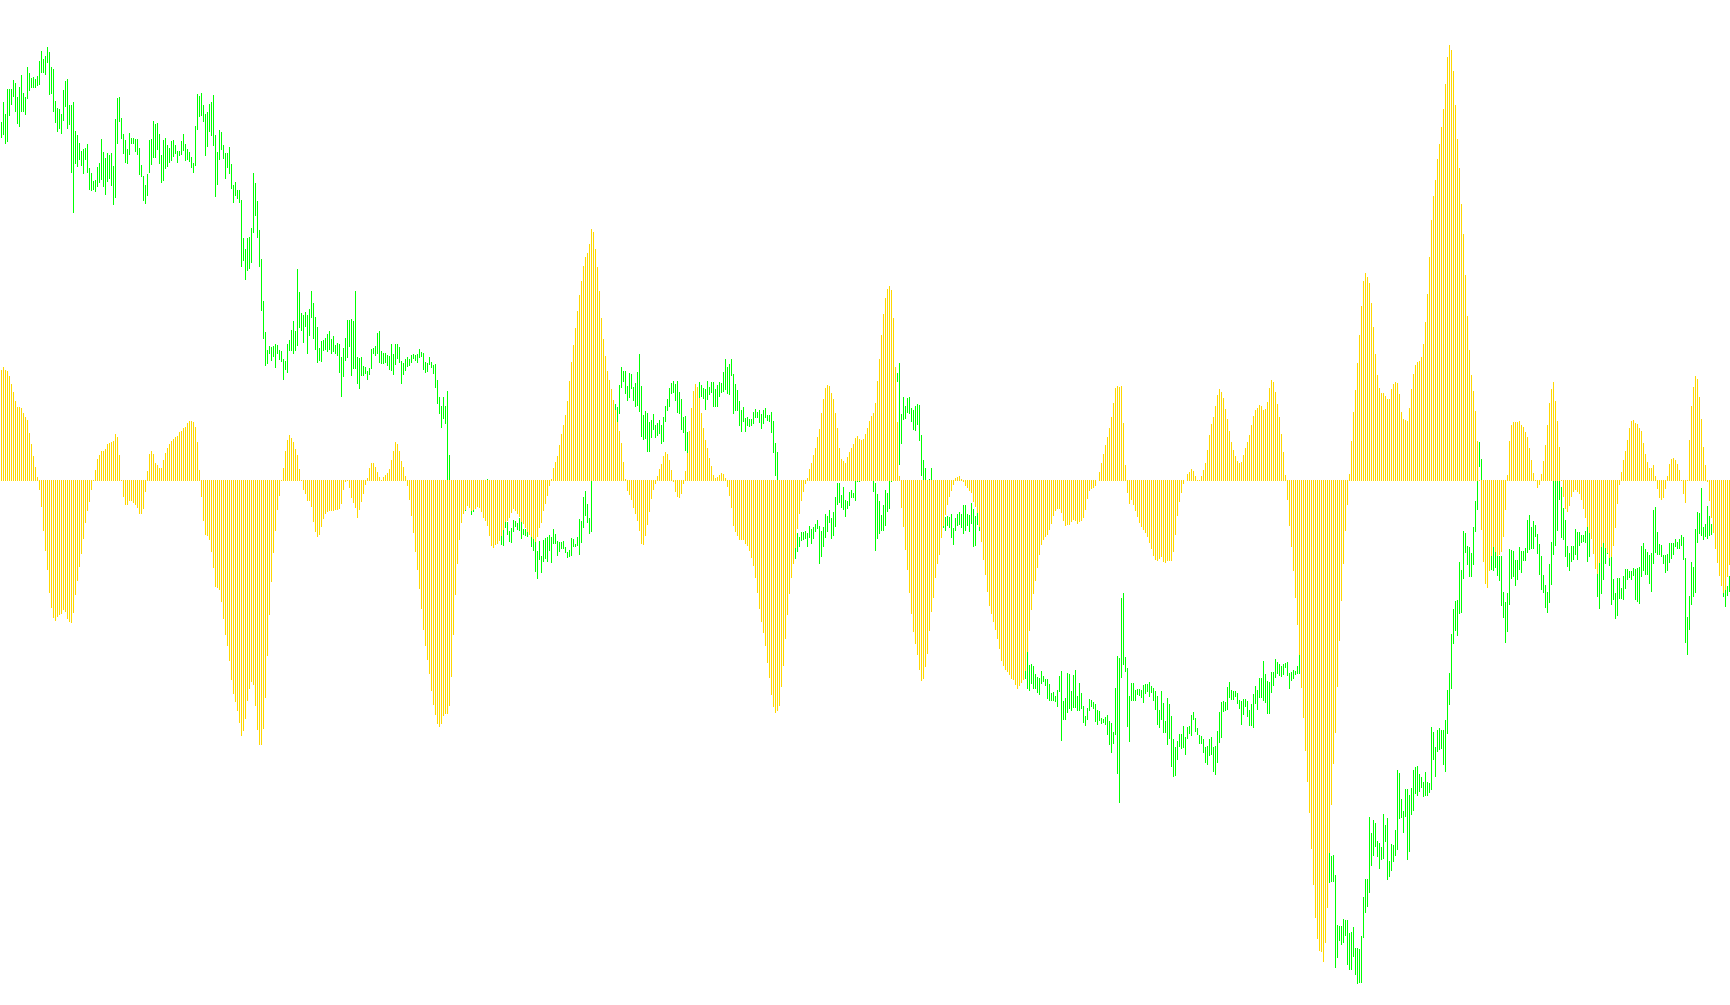
This tool is designed to provide traders with a visual representation of price momentum and market behavior by calculating the relationship between actual price movements and smoothed moving averages.
How it Works
The script operates by looking back at a specific number of historical candles (the "Lookback Period") to analyze the core data of the market. It performs the following logic:
- Data Collection: For every point on your chart, the tool identifies the high and low prices to determine the "Median Price."
- Smoothing & Weighting: The tool calculates two distinct sets of values. First, it takes the raw median price data and applies a weighted calculation. Second, it takes a smoothed moving average (specifically a Smoothed Moving Average) and applies that same weighting logic.
- Comparative Analysis: By comparing these two sets of data—the raw price behavior versus the smoothed trend—the tool calculates a ratio. This ratio essentially measures how much the current price is "deviating" or "pulling away" from its established moving average.
- Logarithmic Conversion: To make this information readable and useful for technical analysis, the tool converts the resulting ratio into a logarithmic value. This ensures that the fluctuations are scaled appropriately rather than showing erratic jumps in numbers.
Visual Output
The final result is displayed as a histogram on a separate window below your main price chart.
- Directional Logic: The tool contains specific logic for major currency pairs (such as EURUSD, GBPUSD, etc.). For these specific pairs, it applies a negative multiplier to the calculation; for all other assets, it uses a positive multiplier. This ensures that the visual direction of the histogram remains consistent with the market's behavior across different types of instruments.
- Interpretation: The histogram serves as a gauge. When the values on the histogram move significantly in one direction or the other, it indicates a period of relative strength or weakness in the price action compared to its recent history.
Indicators Used
Miscellaneous
14
Views
1
Downloads
0
Favorites
CoeffoLine_Hist1
//+------------------------------------------------------------------+
//|                                                  CoeffofLine.mq4 |
//|                                        Ramdass - Conversion only |
//+------------------------------------------------------------------+

#property indicator_separate_window
#property indicator_buffers 1
#property indicator_color1 Red

extern int ndot=30;
extern int CountBars=10000;
//---- buffers
double cfl[];

//+------------------------------------------------------------------+
//| Custom indicator initialization function                         |
//+------------------------------------------------------------------+
int init()
  {
   string short_name;
//---- indicator line
   IndicatorBuffers(1);
   SetIndexStyle(0,DRAW_HISTOGRAM);
   SetIndexBuffer(0,cfl);
//----
   return(0);
  }
//+------------------------------------------------------------------+
//| CoeffofLine_v1                                                              |
//+------------------------------------------------------------------+
int start()
  {

   if (CountBars>=Bars) CountBars=Bars;
   SetIndexDrawBegin(0,Bars-CountBars+ndot+1);
   int i,shift,cnt,ndot1,counted_bars=IndicatorCounted();
   double TYVar,ZYVar,TIndicatorVar,ZIndicatorVar,M,N,AY,AIndicator;
//----
   if(Bars<=ndot) return(0);

//----
   shift=CountBars-ndot-1;


   while(shift>=0)
      {

      TYVar=0;
	   ZYVar=0;
	   N=0;
   	M=0;
	   TIndicatorVar=0;
	   ZIndicatorVar=0;
	   ndot1=ndot;
	   if (shift+1<ndot1) ndot1=shift+1;
	      for (cnt=ndot; cnt>=1; cnt--)
            {
		      N=N+cnt*cnt;
		      M=M+cnt;
	         }
	      for (cnt=ndot1; cnt>=1; cnt--)
            {
		      ZYVar=ZYVar+(High[shift-cnt+1]+Low[shift-cnt+1])/2*(ndot+1-cnt);
		      TYVar=TYVar+(High[shift-cnt+1]+Low[shift-cnt+1])/2;
		      ZIndicatorVar=ZIndicatorVar+iMA(NULL,0,5,3,MODE_SMMA,PRICE_MEDIAN,shift-cnt+1)*(ndot+1-cnt);
		      TIndicatorVar=TIndicatorVar+iMA(NULL,0,5,3,MODE_SMMA,PRICE_MEDIAN,shift-cnt+1);
	         }
         AY=(TYVar+(N-2*ZYVar)*ndot/M)/M;
	      AIndicator=(TIndicatorVar+(N-2*ZIndicatorVar)*ndot/M)/M;
      	if (Symbol()=="EURUSD" || Symbol()=="GBPUSD" || Symbol()=="USDCAD" || Symbol()=="USDCHF"
	           || Symbol()=="EURGBP" || Symbol()=="EURCHF" || Symbol()=="AUDUSD"
	           || Symbol()=="GBPCHF")
         	{cfl[shift]=(-1000)*MathLog(AY/AIndicator);}
	      else {cfl[shift]=(1000)*MathLog(AY/AIndicator);}
      shift--;
      }
   return(0);
   }
//+------------------------------------------------------------------+
Comments