CoeffoLine_fixed
Download script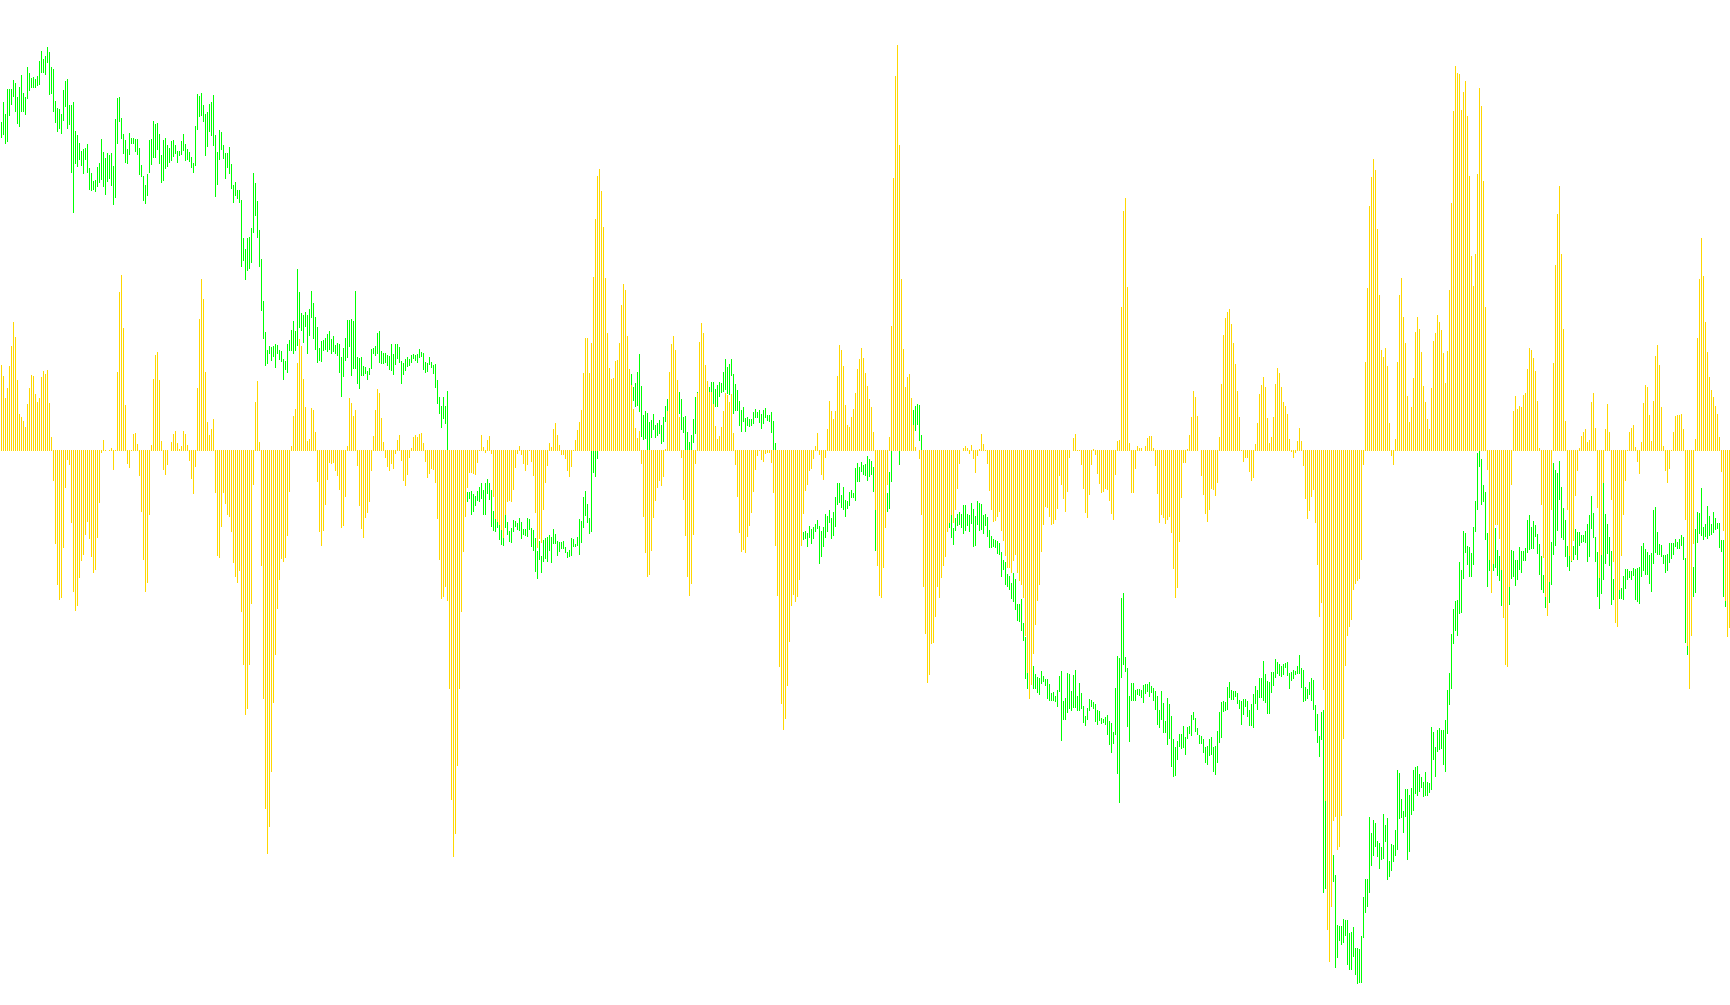
This tool is designed to analyze market trends by comparing two different types of price averages. It operates by looking at a specific window of historical price data to calculate a "Coefficient of Line," which helps traders visualize the relationship between standard price movement and a smoothed momentum indicator.
How the Logic Works
1. Data Collection and Weighting The script looks back at a set number of previous bars (the user can define how much history is analyzed). For every point in that history, it identifies the midpoint between the high and low prices. It then applies a "weighting" system to these points; rather than treating all data equally, it gives more significance to the most recent price movements, allowing the indicator to be more responsive to current market conditions.
2. Comparative Analysis The script performs two parallel calculations simultaneously:
- The Primary Value (AY): A weighted average of the raw mid-point prices.
- The Secondary Value (AIndicator): A weighted average of a specific moving average (a smoothed median price).
By calculating these two different types of averages, the script can measure the "gap" or divergence between actual price action and the underlying trend.
3. The Final Calculation (The Coefficient) Once both values are calculated, the script compares them to determine a ratio. It uses a logarithmic calculation to transform this ratio into a specific numerical value. This value is then displayed as a histogram on a separate window in your trading platform.
4. Currency-Specific Adjustments The script contains a unique logic gate for different currency pairs. Depending on which asset you are trading (such as EURUSD, GBPUSD, etc.), the script will automatically flip the direction of the result (positive or negative). This ensures that the visual output remains consistent and readable across various major global currencies by accounting for their specific price characteristics.
Summary for the Trader
Essentially, this script acts as a "divergence" tracker. It measures how much the current market price is stretching away from its smoothed trend line. By viewing the resulting histogram, you can observe the intensity of these movements, providing a visual representation of market momentum and potential overextension.
//+------------------------------------------------------------------+
//| CoeffofLine.mq4
//| Ramdass - Conversion only
//+------------------------------------------------------------------+

#property indicator_separate_window
#property indicator_buffers 1
#property indicator_color1 Red


extern int ndot=5;
extern int CountBars=10000;
//---- buffers
double cfl[];


//+------------------------------------------------------------------+
//| Custom indicator initialization function                         |
//+------------------------------------------------------------------+
int init()
  {
   string short_name;
//---- indicator line
   IndicatorBuffers(1);
   SetIndexStyle(0,DRAW_HISTOGRAM);
   SetIndexBuffer(0,cfl);
//----
   return(0);
  }
//+------------------------------------------------------------------+
//| CoeffofLine_v1                                                              |
//+------------------------------------------------------------------+
int start()
  {


   if (CountBars>=Bars) CountBars=Bars;
   SetIndexDrawBegin(0,Bars-CountBars+ndot+1);
   int i,shift,cnt,ndot1,counted_bars=IndicatorCounted();
   double TYVar,ZYVar,TIndicatorVar,ZIndicatorVar,M,N,AY,AIndicator;
//----
   if(Bars<=ndot) return(0);

//----
   shift=CountBars-ndot-1;


   while(shift>=0)
     {

   TYVar=0;
	ZYVar=0;
	N=0;
	M=0;
	TIndicatorVar=0;
	ZIndicatorVar=0;
	ndot1=ndot;
	if (shift+1<ndot1) ndot1=shift+1;
	for (cnt=ndot; cnt>=1; cnt--) // n=5 -  ïî ïÿòè òî÷êàì
	{
		N=N+cnt*cnt;  //ðàâíî 55
		M=M+cnt;      //ðàâíî 15
	}
	for (cnt=ndot1; cnt>=1; cnt--) // n=5 -  ïî ïÿòè òî÷êàì
	{
		ZYVar=ZYVar+(High[shift+cnt-1]+Low[shift+cnt-1])/2*(ndot+1-cnt);
		TYVar=TYVar+(High[shift+cnt-1]+Low[shift+cnt-1])/2;
		ZIndicatorVar=ZIndicatorVar+iMA(NULL,0,5,3,MODE_SMMA,PRICE_MEDIAN,shift+cnt-1)*(ndot+1-cnt);
		TIndicatorVar=TIndicatorVar+iMA(NULL,0,5,3,MODE_SMMA,PRICE_MEDIAN,shift+cnt-1);
	}
	AY=(TYVar+(N-2*ZYVar)*ndot/M)/M;
	AIndicator=(TIndicatorVar+(N-2*ZIndicatorVar)*ndot/M)/M;
	if (Symbol()=="EURUSD" || Symbol()=="GBPUSD" || Symbol()=="USDCAD" || Symbol()=="USDCHF"
	 || Symbol()=="EURGBP" || Symbol()=="EURCHF" || Symbol()=="AUDUSD"
	 || Symbol()=="GBPCHF")
	{cfl[shift]=(-1000)*MathLog(AY/AIndicator);}
	else {cfl[shift]=(1000)*MathLog(AY/AIndicator);}


      shift--;
     }
   return(0);
  }
//+------------------------------------------------------------------+
Comments