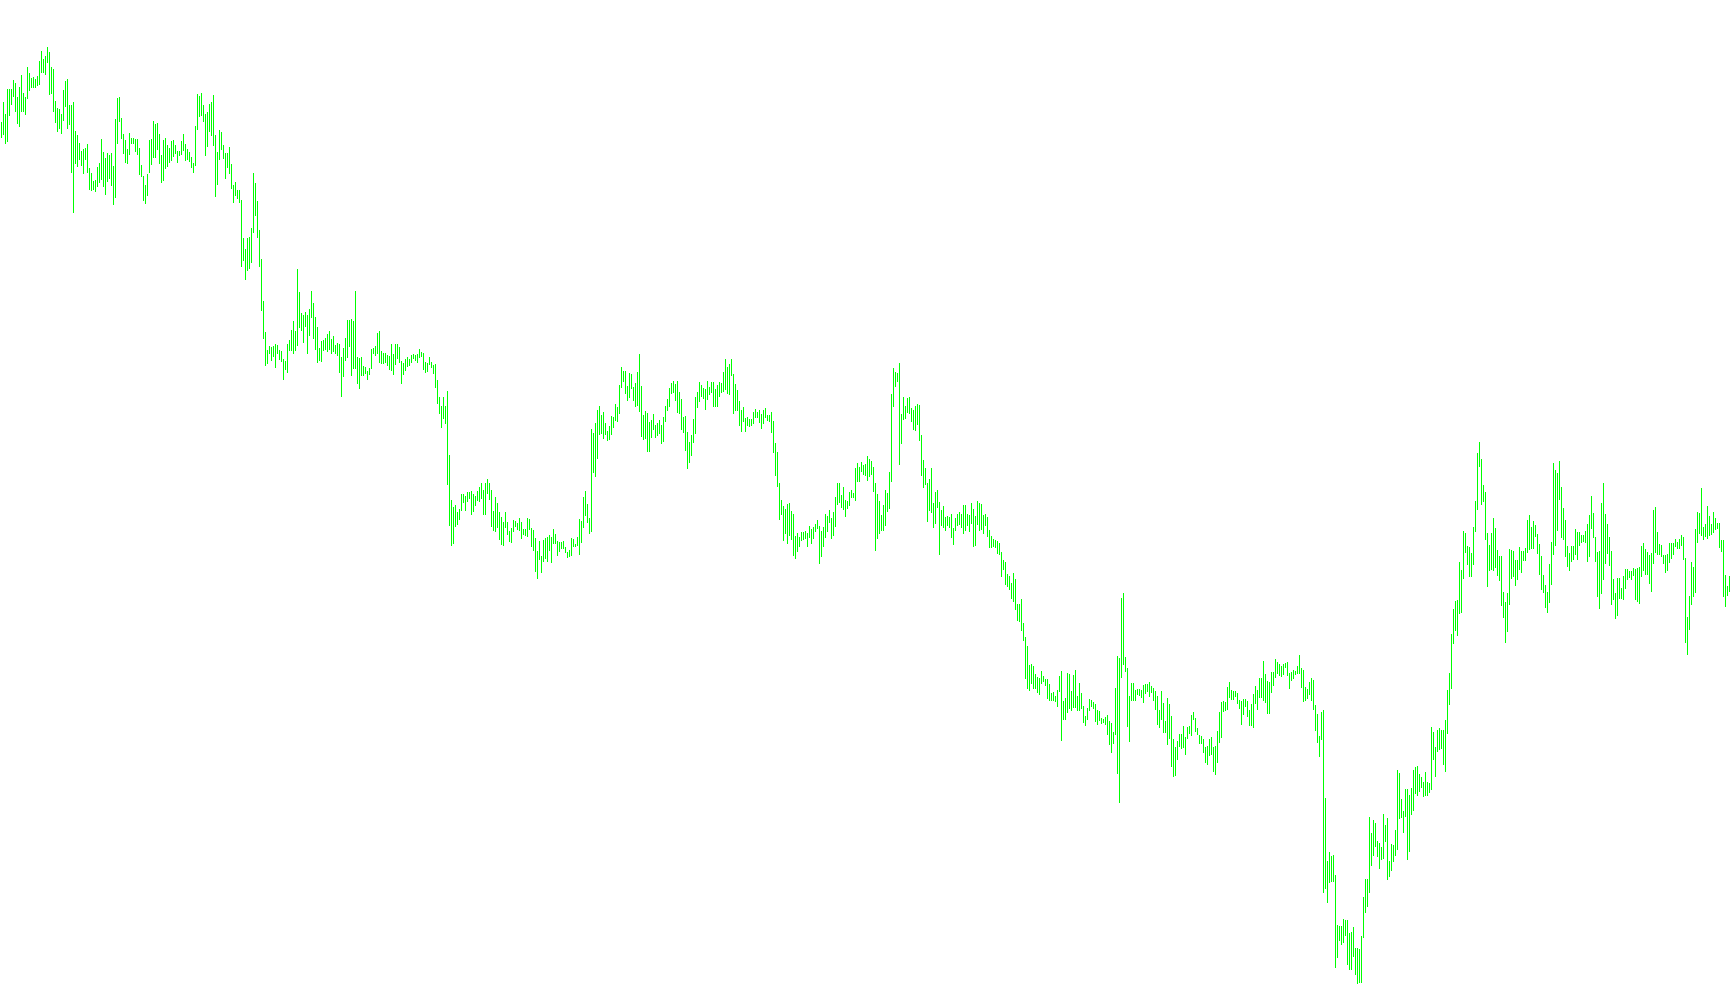
Okay, here's a breakdown of what this MetaTrader script does, explained in plain language for someone who doesn't program. I'm focusing on the purpose and logic rather than the technical details of the code itself.
Overall Purpose: Identifying Potential Trend Reversals
This script, called "BrainTrend1," is designed to help traders identify potential turning points in the market – moments when an existing trend might be about to change direction. It aims to provide visual signals that suggest when a price might be poised to move up or down. It's a custom "indicator" that's displayed on a price chart alongside the regular price data.
Key Concepts & How It Works
-
Trend Following & Reversal Signals: The script tries to find periods where the price action is showing signs of weakening or becoming unstable. These signs can suggest that the current trend is losing momentum and a reversal might be coming.
-
Input Parameters (Customization):
- RISK: This parameter controls the sensitivity of the indicator. A higher value makes the indicator less sensitive to small price fluctuations, potentially reducing false signals but also potentially missing some opportunities.
- CountBars: This determines how many historical price bars (candles) the script looks back to calculate its signals. A larger number of bars provides a longer-term perspective, while a smaller number focuses on more recent price action.
-
Core Logic – The "Brain" of the Indicator
- Calculating Average Range: The script first calculates the average range of price movement (the difference between the high and low prices) over a specific period. This helps to understand the typical volatility of the market.
- Identifying "True Counts": It then looks for specific price patterns. It's searching for instances where the difference between the opening and closing prices is significantly larger than the average range. These larger differences are considered "True Counts" and are seen as potential signs of instability.
- Using PercentR (Williams %R): The script incorporates a calculation called PercentR (also known as Williams %R). This is a standard technical indicator that measures the price relative to its recent high/low range. It helps to identify overbought or oversold conditions.
- Creating Visual Bands: Based on the calculations above, the script draws two colored bands (one red, one blue) on the chart. These bands represent potential support and resistance levels. The colors indicate the direction of the potential reversal.
- Red Band: Suggests a potential upward reversal (price might be about to rise).
- Blue Band: Suggests a potential downward reversal (price might be about to fall).
-
Historical Data: The script analyzes a defined number of past price bars (candles) to generate these signals. This historical perspective helps to filter out short-term noise and identify more reliable potential reversals.
In Simple Terms – What You See on the Chart
- Colored Bands: The red and blue bands are the primary visual output. They are placed on the chart to indicate potential support and resistance levels.
- Interpretation: Traders use these bands as potential buy or sell signals. For example, if the price touches the red band, it might be a signal to buy, anticipating a price increase. Conversely, if the price touches the blue band, it might be a signal to sell, anticipating a price decrease.
Important Notes
- Not a Guarantee: This indicator, like all technical indicators, is not a foolproof predictor of future price movements. It's a tool to help traders make informed decisions, but it should not be relied upon as the sole basis for trading decisions.
- Confirmation: It's often recommended to use this indicator in conjunction with other technical analysis tools and strategies to confirm potential signals.
- Parameter Optimization: The
RISKandCountBarsparameters can be adjusted to fine-tune the indicator's sensitivity and responsiveness to different market conditions.
I hope this explanation helps you understand the purpose and logic of the script without getting bogged down in the technical code.
//+-----------------------------------------------------------------------+
//|                                                       BrainTrend1.mq4 |
//|                                   Copyright © 2005. Alejandro Galindo |
//|                                                   http://elCactus.com |
//|         ASCTrend1 modified to generate similar signals to BrainTrend1 |
//|           	Author := C0Rpus - big thanks CHANGE2002, STEPAN and SERSH |
//|	                                 Notes := ASCTrend1 3.0 Open Source |
//+-----------------------------------------------------------------------+

#property indicator_chart_window
#property indicator_buffers 2
#property indicator_color1 Red
#property indicator_color2 Blue
//---- input parameters
extern int RISK=3;
extern int CountBars=500;
//---- buffers
double Buffer1[];
double Buffer2[];
//+------------------------------------------------------------------+
//| Custom indicator initialization function                         |
//+------------------------------------------------------------------+
int init()
  {
//---- indicator line
   IndicatorBuffers(2);
   SetIndexStyle(0,DRAW_HISTOGRAM,0,1);
   SetIndexStyle(1,DRAW_HISTOGRAM,0,1);
   SetIndexBuffer(0,Buffer1);
   SetIndexBuffer(1,Buffer2);
//----
   return(0);
  }
//+------------------------------------------------------------------+
//| ASCTrend1                                                        |
//+------------------------------------------------------------------+
int start()
  {
   if (CountBars>=Bars) CountBars=Bars;
   SetIndexDrawBegin(0,Bars-CountBars+11+1);
   SetIndexDrawBegin(1,Bars-CountBars+11+1);
   int i,shift,counted_bars=IndicatorCounted();
   int Counter,i1,value10,value11;
   double value1,x1,x2;
   double value2,value3;
   double TrueCount,Range,AvgRange,MRO1,MRO2;
   value10=3+RISK*2;
   x1=67+RISK;
   x2=33-RISK;
   value11=value10;
//----
   if(Bars<=value11+1) return(0);
//---- initial zero
   if(counted_bars<value11+1)
     {
      for(i=1;i<=0;i++) Buffer1[CountBars-i]=0.0;
      for(i=1;i<=0;i++) Buffer2[CountBars-i]=0.0;
     }
//----
   shift=CountBars-11-1;
   while(shift>=0)
     {
      Counter=shift;
      Range=0.0;
      AvgRange=0.0;
      for(Counter=shift; Counter<=shift+9; Counter++) AvgRange=AvgRange+MathAbs(High[Counter]-Low[Counter]);
      Range=AvgRange/10;
      Counter=shift;
      TrueCount=0;
      while(Counter<shift+9 && TrueCount<1)
        {if (MathAbs(Open[Counter]-Close[Counter+1])>=Range*2.0) TrueCount=TrueCount+1;
         Counter=Counter+1;
        }
      if (TrueCount>=1) {MRO1=Counter;} else {MRO1=-1;}
      Counter=shift;
      TrueCount=0;
      while(Counter<shift+6 && TrueCount<1)
        {if (MathAbs(Close[Counter+3]-Close[Counter])>=Range*4.6) TrueCount=TrueCount+1;
         Counter=Counter+1;
        }
      if (TrueCount>=1) {MRO2=Counter;} else {MRO2=-1;}
      if (MRO1>-1) {value11=3;} else {value11=value10;}
      if (MRO2>-1) {value11=4;} else {value11=value10;}
      value2=100-MathAbs(iWPR(NULL,0,value11,shift)); // PercentR(value11=9)
      Buffer1[shift]=0;
      Buffer2[shift]=0;
      if (value2>x1)
        {
         Buffer1[shift]=Low[shift]; Buffer2[shift]=High[shift];
        }
      if (value2<x2)
        {
         Buffer1[shift]=High[shift]; Buffer2[shift]=Low[shift];
        }
      shift--;
     }
   return(0);
  }
//+------------------------------------------------------------------+
Comments