Camarilla_v2
Indicator

Camarilla_v2

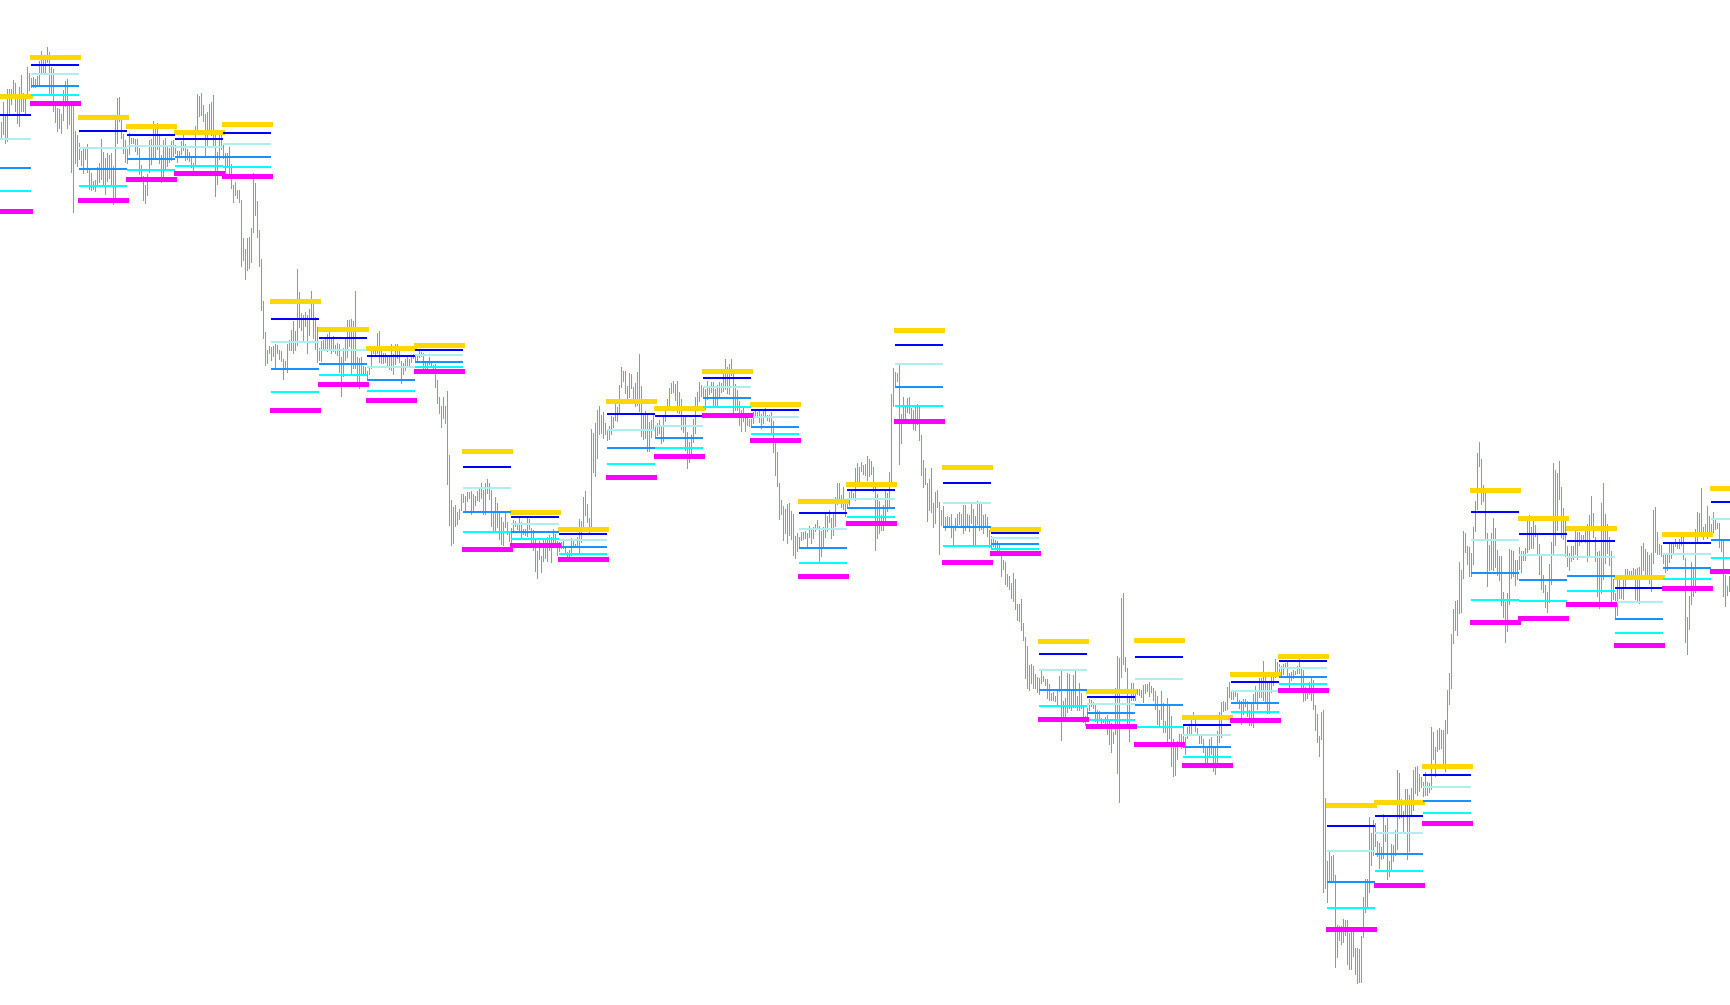
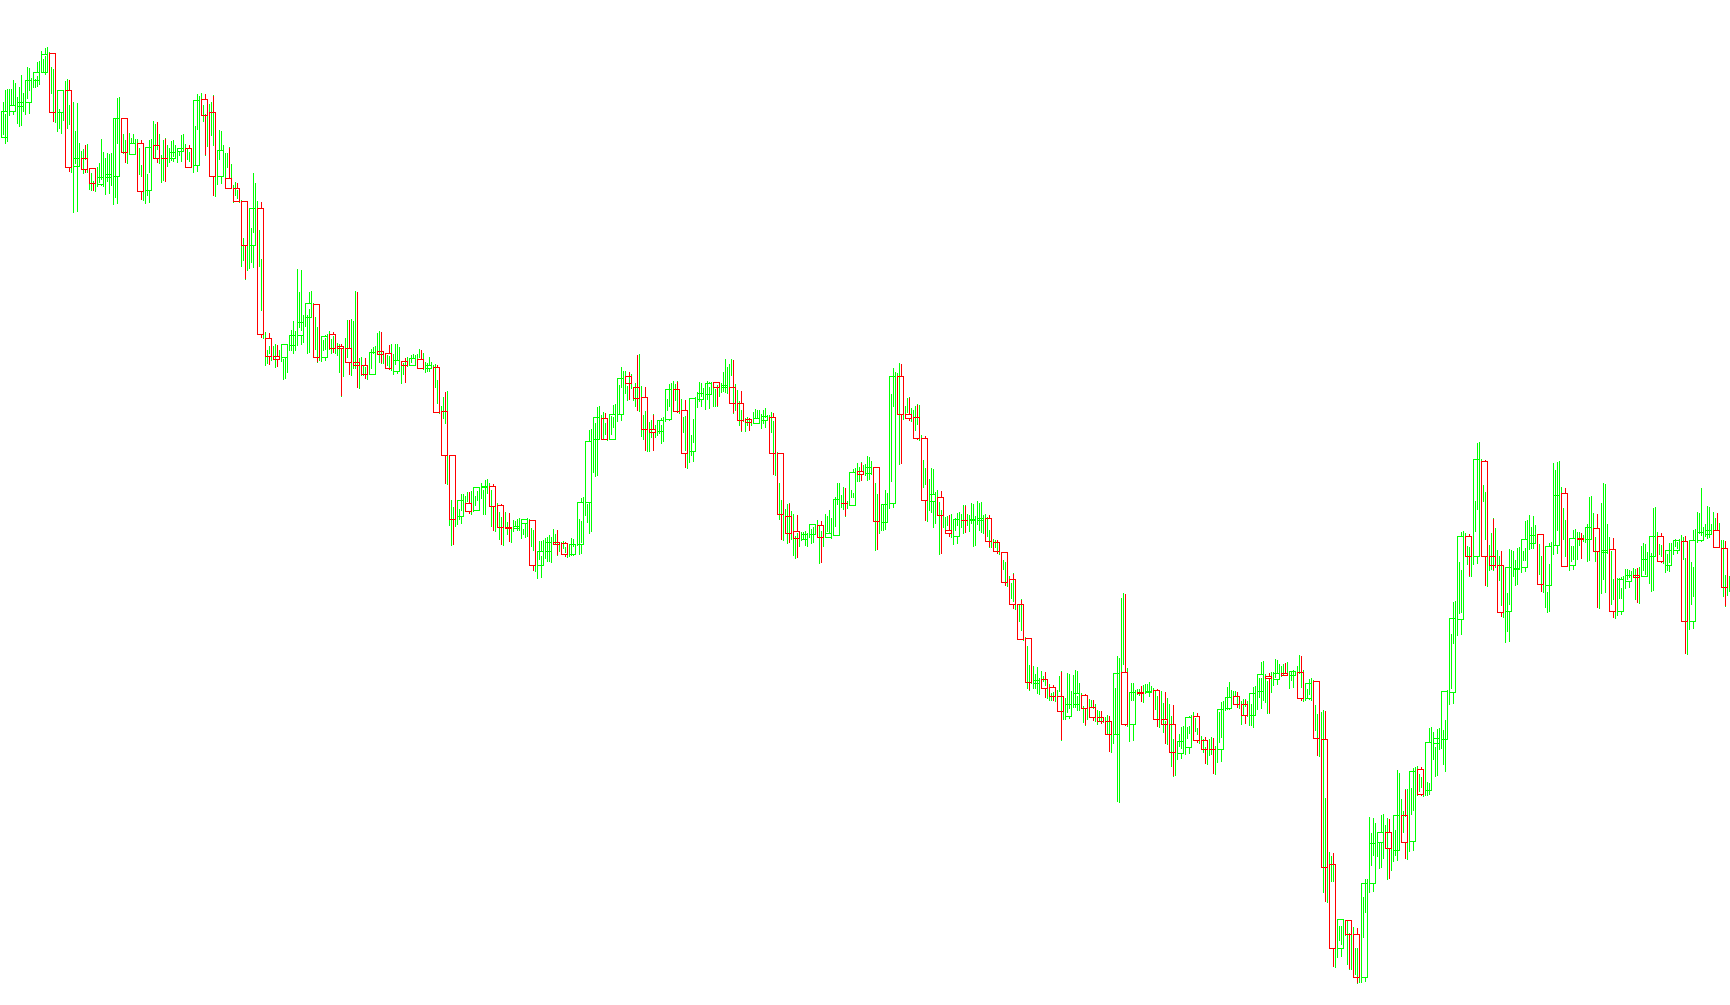
This indicator calculates and plots specific Camarilla pivot levels (H3, H4, L3, L4) based on previous daily price action to identify potential breakout zones.

Cams_Daily_Break
Indicator

Cams_Daily_Break

This indicator calculates and plots multi-level Camarilla pivot points based on a user-defined session range to identify potential reversal and breakout levels.

Cams_Daily_Rev
Indicator

Cams_Daily_Rev

This indicator projects specific Camarilla price levels by calculating mathematical offsets from the previous period's high, low, and closing prices.

Cams_Weekly_Break
Indicator

Cams_Weekly_Break

This indicator calculates price targets and pivot zones by projecting Fibonacci-based offsets from the previous week's closing price relative to its high-low range.

Cams_Weekly_Rev
Indicator

Cams_Weekly_Rev

This indicator identifies specific price levels by calculating linear offsets from the previous week's closing price based on its total high-low range.

cam_H1_H5_Historical
Indicator

cam_H1_H5_Historical

This indicator projects historical Camarilla support and resistance levels by calculating price ranges based on previous day's high, low, and closing values.

cam_H1_H5_Historical_v1
Indicator

cam_H1_H5_Historical_v1

This indicator dynamically calculates and plots historical Camarilla resistance levels (H1-H5) and a central pivot point based on previous daily price action to identify potential reversal zones.

cam_H1_H5_Historical_v2
Indicator

cam_H1_H5_Historical_v2

This indicator projects multi-level daily Camarilla pivot points and dynamic resistance levels based on historical high, low, and closing price data.

cam_H2_H5_Historical
Indicator

cam_H2_H5_Historical

This indicator calculates and plots historical Camarilla resistance levels (H2-H5) and the central pivot point based on the previous day's high, low, and closing prices.

cam_H2_H5_Historical5
Indicator

cam_H2_H5_Historical5

This indicator projects historical multi-level pivot points and resistance levels based on previous daily high, low, and closing price data to identify potential reversal zones.

cam_H2_H5_Historical_001
Indicator

cam_H2_H5_Historical_001

This indicator dynamically projects historical Camarilla price levels and central pivots by calculating geometric proportions based on previous daily high, low, and closing price data.

cam_H2_H5_Historical_v1
Indicator

cam_H2_H5_Historical_v1

This indicator calculates and plots historical Camarilla pivot levels and price thresholds based on the preceding day's high, low, and closing prices.

cam_H2_H5_Historical_v2
Indicator

cam_H2_H5_Historical_v2

This indicator calculates and plots historical Camarilla resistance levels (H2, H3, H4, H5) and the central pivot point based on preceding daily price action.

cam_H2_H5_Historical_v3
Indicator

cam_H2_H5_Historical_v3

This indicator calculates and plots historical Camarilla Pivot levels by deriving price boundaries from previous daily highs, lows, and closing prices.

cam_L1_L5_Historical
Indicator

cam_L1_L5_Historical

This indicator dynamically plots five historical Camarilla support and resistance levels based on previous daily high, low, and close price action.

cam_L1_L5_Historical_v1
Indicator

cam_L1_L5_Historical_v1

This indicator calculates and plots five historical Camarilla pivot levels based on previous day's price action to identify potential support and resistance zones.

cam_L2_L5_Historical
Indicator

cam_L2_L5_Historical

This indicator dynamically projects historical L2 through L5 pivot levels based on previous day's price extremes and closing values to identify potential reversal zones.

cam_L2_L5_Historical5
Indicator

cam_L2_L5_Historical5

This indicator calculates and plots historical Camarilla pivot levels (L2 through L5) based on the previous day's high, low, and closing prices to identify potential support and resistance zones.

cam_L2_L5_Historical_001
Indicator

cam_L2_L5_Historical_001

This indicator dynamically calculates and plots specific daily camarilla pivot levels (L2-L5) based on previous session high, low, and close price data to identify potential liquidity zones.

cam_L2_L5_Historical_v1
Indicator

cam_L2_L5_Historical_v1

This indicator projects historical Camarilla support and resistance levels by calculating specific price percentages based on the previous day's high, low, and closing values.

cam_L2_L5_Historical_v2
Indicator

cam_L2_L5_Historical_v2

This indicator calculates and plots historical daily Camarilla pivot levels (L2-L5) based on previous session high, low, and closing price data to identify significant reversal zones.

Cam_Supp
Indicator

Cam_Supp

This indicator projects historical daily price boundaries by calculating specific percentage-based pivot levels to identify potential breakout zones and trend reversals.

CanadosIndicator
Indicator

CanadosIndicator

The logic identifies the highest and lowest price points over a specific period and projects fixed-distance buffers to delineate potential reversal zones.

Indicator

Cancel Open Stop or Limit Orders

Candle MA Long
Indicator

Candle MA Long

iMA

Identifies directional bias by visualizing the ascending trajectory of three concurrent exponential moving averages to highlight active price momentum.

Candle MA Long_
Indicator

Candle MA Long_

iMA

This indicator identifies trend momentum by mapping three distinct exponential moving averages and highlighting their upward trajectory through directional slope filtering.

Candle MA Short
Indicator

Candle MA Short

iMA

This indicator visualizes rapid price momentum by plotting three overlapping Exponential Moving Averages and highlighting their upward directional shifts.

Candle MA Short_
Indicator

Candle MA Short_

iMA

This indicator identifies short-term trend dynamics by projecting three overlapping Exponential Moving Averages and highlighting bullish upward slopes through discrete visual segments.

Indicator

Candle Signal

iMACD
CandleAverage_v3
Indicator

CandleAverage_v3

iMAiMAOnArray

This indicator quantifies price imbalance by comparing the distance between High and Close relative to the distance between Close and Low across smoothed exponential moving averages.

CandleBodyPrcnt
Indicator

CandleBodyPrcnt

This script calculates the arithmetic mean of the percentage of candle bodies relative to their total range across the entire historical data set.
CandleBreaker
Indicator

CandleBreaker

iFractals
CandleSizeAlert
Indicator

CandleSizeAlert

This indicator identifies and triggers real-time alerts for individual candles whose absolute price movement exceeds a user-defined point threshold relative to the average volatility of the preceding ten bars.
Candlestick Identification_MT4_In
Indicator

Candlestick Identification_MT4_In

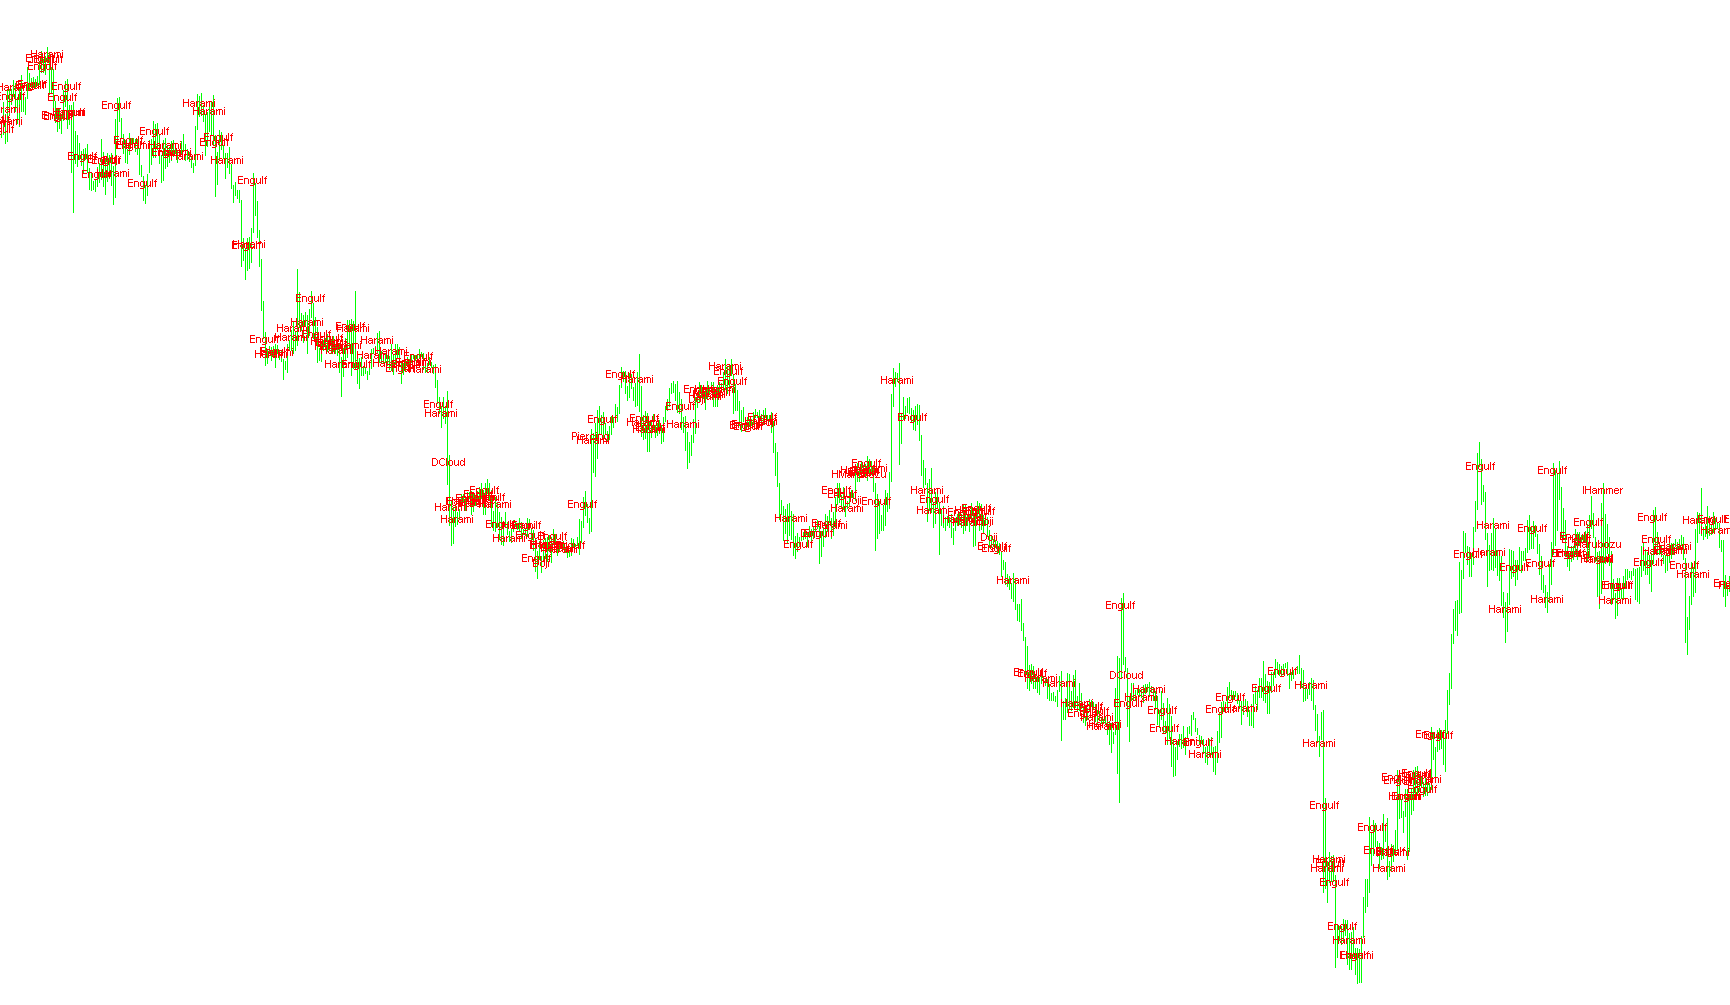
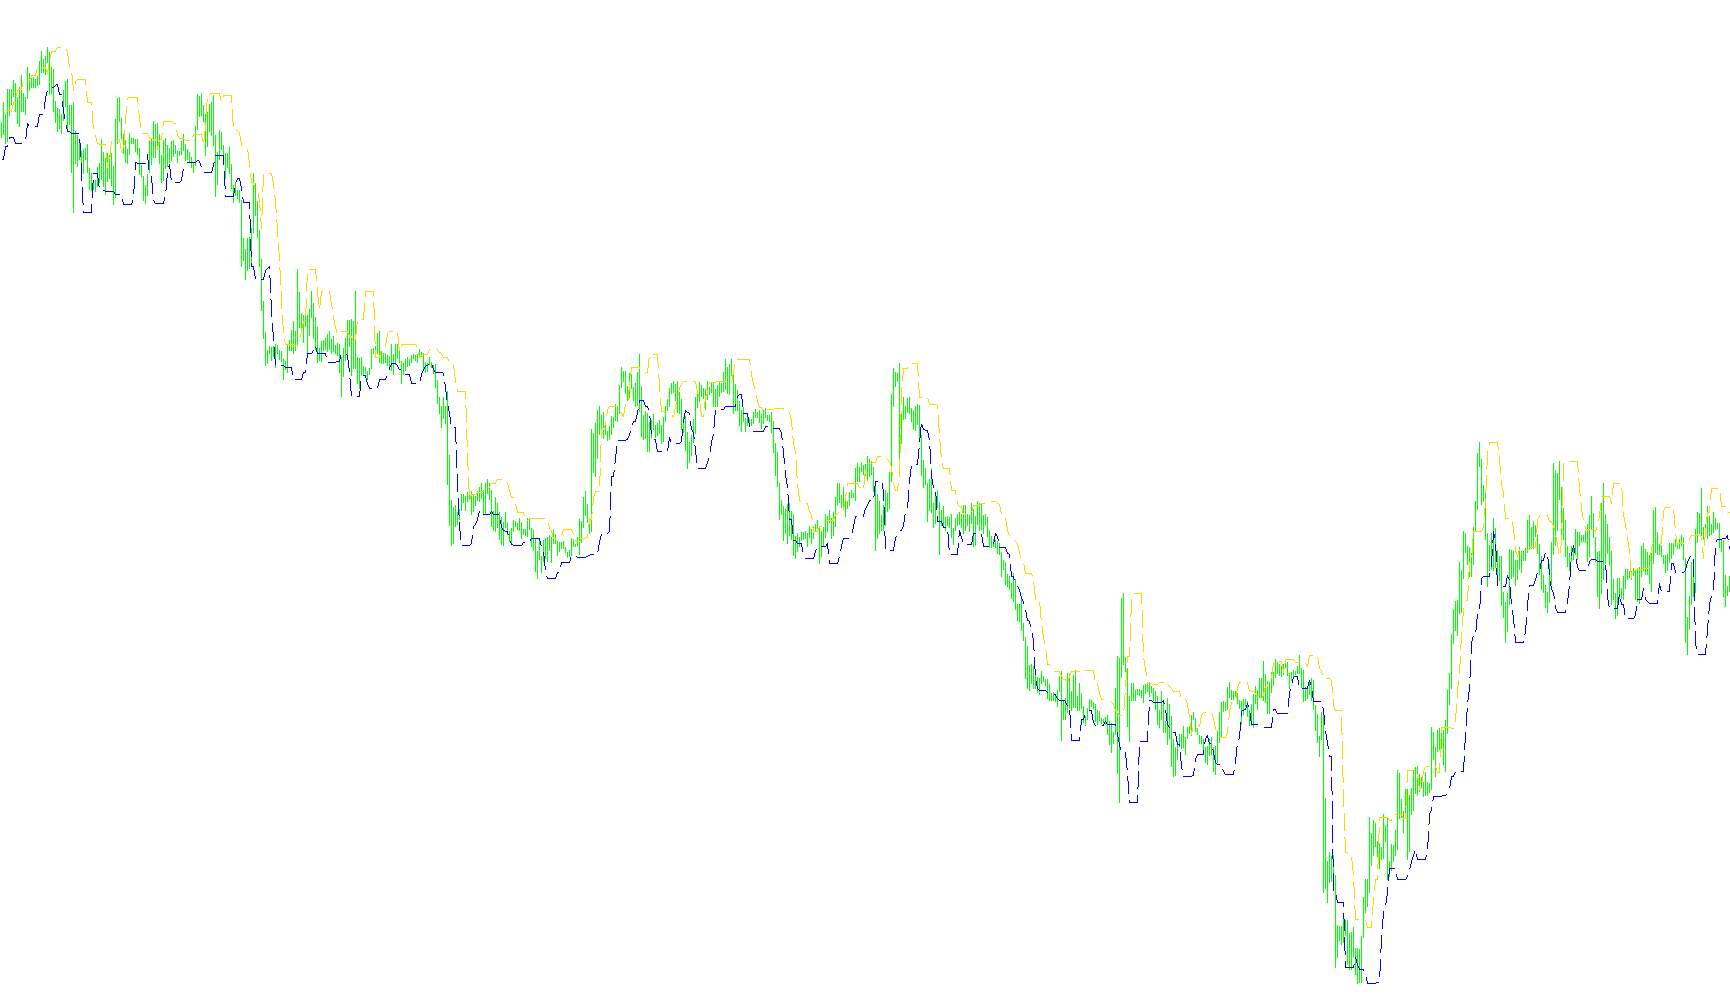
This indicator scans historical price data to detect and visually label specific Japanese candlestick patterns including Marubozu, Engulfing, Harami, Doji, and Shooting Star variations.

CandleStick
Indicator

CandleStick

This indicator identifies market reversals and trend continuations by detecting specific candlestick patterns such as Hammers, Shooting Stars, and High Waves using multi-period amplitude normalization.

Candlesticks
Indicator

Candlesticks

iACiAO

This indicator visualizes market sentiment by mapping price action high/low extremes and candle body dynamics based on the convergence of Williams Accelerator Oscillator and Williams %R.

CandlesticksBW
Indicator

CandlesticksBW

iACiAO

The indicator identifies bullish and bearish price actions by correlating ascending Awesome Oscillator (AO) and Average Centrality (AC) trends with specific candle body and wick orientations.

CandlesticksCW
Indicator

CandlesticksCW

iACiAO

This MetaTrader indicator colors candlesticks based on Williams' Awesome Oscillator (AO) and Accelerator Oscillator (AC) values, highlighting bullish and bearish momentum.

CANDLESTICK_001
Indicator

CANDLESTICK_001

iMA

This indicator identifies multiple advanced candlestick patterns, including Engulfing, Harami, and Morning/Evening Stars, while dynamically rendering visual support and resistance boundaries based on price action confirmation.

CandleStop
Indicator

CandleStop

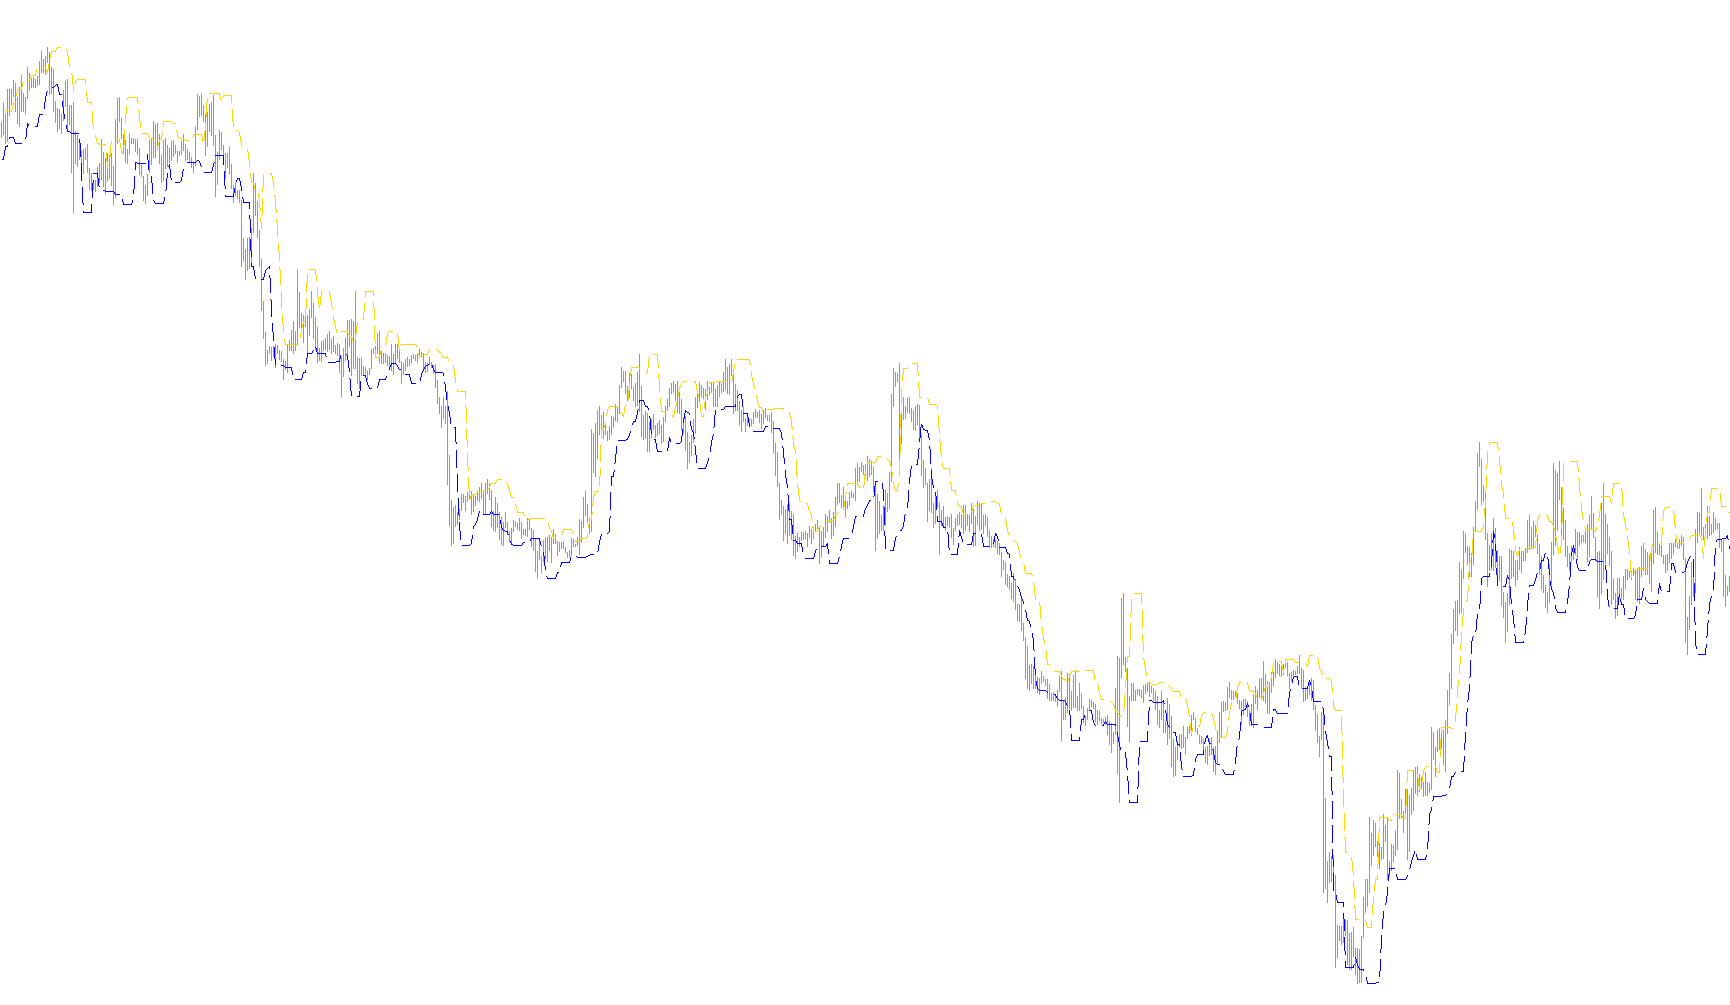
This indicator projects trailing price floors and ceilings by tracking the extreme high and low peaks over a rolling window of preceding candles.

CandleStop_v1
Indicator

CandleStop_v1

The script maps historical price extremes by identifying the rolling peak and trough over a fixed period to visualize structural volatility boundaries.

candles_01
Indicator

candles_01

iMAOnArray

The indicator quantifies market sentiment by calculating the ratio of bullish to bearish candle counts over a lookback period while simultaneously visualizing relative shadow lengths and average body magnitudes.

Candles_HigherTimeFrameBar
Indicator

Candles_HigherTimeFrameBar

This indicator projects historical candles and high-low ranges from a superior timeframe onto the current chart to visualize macro market structure.

Candles_last4barsEli_mtf
Indicator

Candles_last4barsEli_mtf

This indicator visualizes high-timeframe price action by projecting historical candle geometry and open-close movements onto the current lower-timeframe chart.

Indicator

Candles_last4barsEli__mtf_

CandleTime
Indicator

CandleTime

This indicator calculates and displays the precise remaining duration until the current candlestick expires in real-time.

CandleTimeV
Indicator

CandleTimeV

Calculates and visualizes the precise remaining duration until the current candlestick closes by converting server time offsets into a formatted countdown.

Indicator

CandleTime_v1

Candle_CustomCandle_mtf
Indicator

Candle_CustomCandle_mtf

This indicator renders higher timeframe candlestick geometries and shadow extremes onto the current chart to synchronize structural data across nested periods.

Candle_MA
Indicator

Candle_MA

iMAOnArray

This indicator calculates moving averages on various candlestick price components, including relative body proportions, wick lengths, and weighted price types.