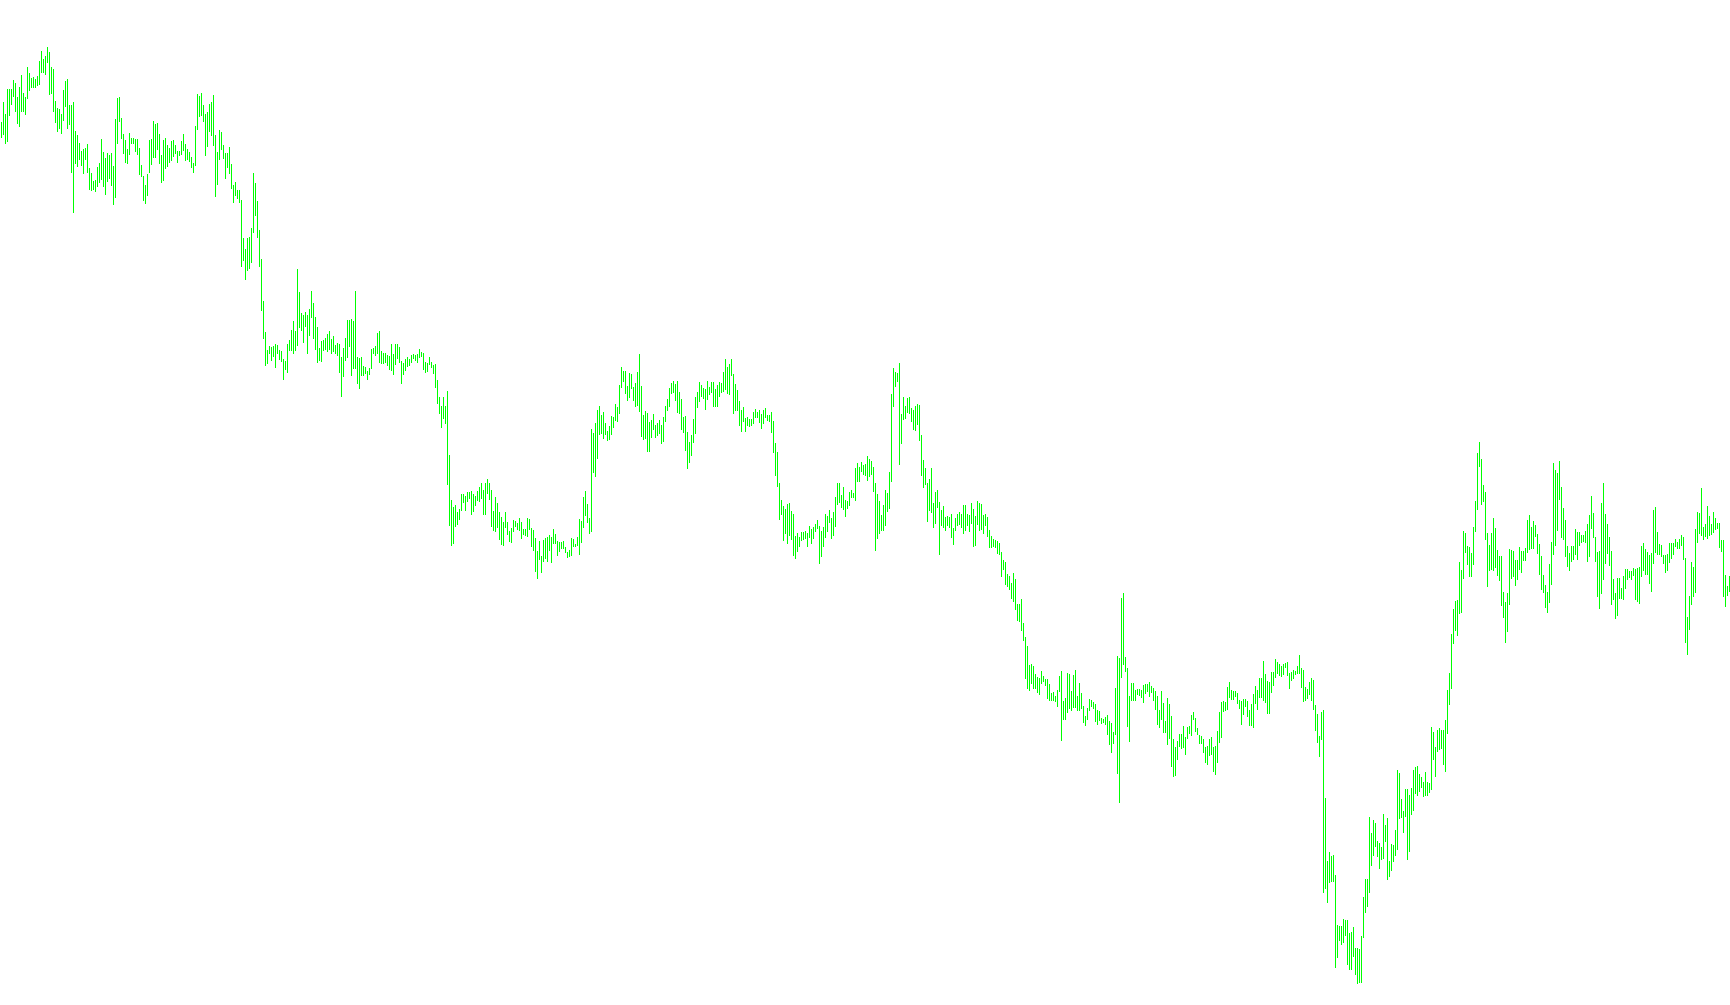
The BrainTrend1Stop is a visual trading indicator designed to help traders identify the prevailing direction of the market and establish potential areas for price reversal or trend exhaustion. By analyzing price action history, it creates a dynamic "buffer zone" that tracks whether the current momentum is bullish (upward) or bearish (downward).
Core Logic and Mechanics
The indicator operates based on three primary components: Volatility Measurement, Trend Tracking, and Reversal Detection.
1. Volatility Measurement (The Buffer Zone) Instead of using a fixed distance for signals, the script calculates a dynamic range based on recent market activity. It looks at the "High" and "Low" prices over a specific period (defined by the user). By calculating the average movement of the price during this time, it creates a volatility-adjusted value. This ensures that the indicator adapts to different market conditions—widening its boundaries during high volatility and narrowing them during quiet markets.
2. Dynamic Trend Tracking The script continuously monitors the relationship between the current closing price and the previous price peaks or troughs.
- In an Uptrend, it seeks to identify the highest recent price point.
- In a Downtrend, it seeks to identify the lowest recent price point.
It essentially "remembers" where the price has been, using that information to project a target level based on the current volatility.
3. Reversal Logic (The "Stop" Mechanism) The indicator works by predicting where a price should stay based on its current trend. It creates an invisible boundary:
- If the market is in an uptrend, the script projects a value slightly below the current price. If the price drops below this calculated threshold, the script interprets this as a loss of momentum and flips the trend to "bearish."
- If the market is in a downtrend, it projects a value slightly above the current price. If the price rises above this threshold, it signals a shift back to a "bullish" trend.
Visual Representation
On your trading chart, the logic translates into visual cues:
- Bullish Signals: When the trend is upward, the indicator tracks the movement and identifies potential support or trend continuation.
- Bearish Signals: When the trend turns downward, the indicator highlights the new direction.
- Markers: The script uses specific symbols (arrows) to plot these critical turning points on your chart, allowing you to see exactly where the logic detected a shift in market sentiment.
Summary for the User
Think of this indicator as an automated "trend follower." It measures how much the market usually moves, looks for the highest or lowest points reached recently, and draws a line that says, "If the price crosses back past this point, the trend has likely changed." It helps filter out minor market noise by requiring a significant enough price movement to trigger a trend switch.
//+-----------------------------------------------------------------------+
//|                                                   BrainTrend1Stop.mq4 |
//|                                   Copyright © 2005. Alejandro Galindo |
//|                                                   http://elCactus.com |
//+-----------------------------------------------------------------------+

#property indicator_chart_window
#property indicator_buffers 2
#property indicator_color1 Red
#property indicator_color2 Blue

//---- input parameters
extern int AveragePeriod=10;
extern int Reg=1;

//---- buffers
double Buffer1[];
double Buffer2[];

//+------------------------------------------------------------------+
//| Custom indicator initialization function                         |
//+------------------------------------------------------------------+
int init()
  {
//---- indicator line
   IndicatorBuffers(2);
   SetIndexStyle(0,DRAW_ARROW);
   SetIndexStyle(1,DRAW_ARROW);
   SetIndexBuffer(0,Buffer1);
   SetIndexBuffer(1,Buffer2);
   SetIndexArrow(0,159);
   SetIndexArrow(1,159);

//----
   return(0);
  }
//+------------------------------------------------------------------+
//| BrainTrend1Stop                                                  |
//+------------------------------------------------------------------+
int start()
  {

   int i,shift,counted_bars=IndicatorCounted();
   double value=0, price=0, trend=0, dK=0, AvgRange=0, WATR=0;
   int bar=0;
   int CountBars=500;
   if (CountBars>=Bars) CountBars=Bars;
   SetIndexDrawBegin(0,Bars-CountBars+11+1);
   SetIndexDrawBegin(1,Bars-CountBars+11+1);

//---- initial zero
   AvgRange=0;
   for (i=1;i<=AveragePeriod;i++)
   {
      dK = 1+(AveragePeriod-i)/AveragePeriod;
      AvgRange=AvgRange+ dK*MathAbs(High[i]-Low[i]);
   }
   if (Point>=0.01) { WATR = (AvgRange/AveragePeriod)*Point; }
   else { WATR = AvgRange/AveragePeriod; }

   if (Close[Bars-1] > Open[Bars-1])
   {
      value = Close[Bars - 1] * (1 - WATR);
      trend = 1;
      Buffer2[Bars-1]=value;
   }
   if (Close[Bars-1] < Open[Bars-1])
   {
      value = Close[Bars - 1] * (1 + WATR);
      trend = -1;
      Buffer1[Bars-1]=value;
   }

   bar=CountBars-11-1;
   while(bar>=0)
   {

   Buffer1[shift]=0;
   Buffer2[shift]=0;


   if (Reg==2)
   {
      AvgRange=0;
      for (i=1;i<=AveragePeriod;i++)
      {
         dK = 1+(AveragePeriod-i)/AveragePeriod;
         AvgRange=AvgRange+ dK*MathAbs(High[bar + i]-Low[bar + i]);
      }
      if (Point>=0.01) { WATR = (AvgRange/AveragePeriod)*Point; }
      else { WATR = AvgRange/AveragePeriod; }

   }

   if (trend >= 0)
   {
      if (Close[bar] > price) { price = Close[bar]; }
      value = price * (1 - WATR);
      if (Close[bar] < value)
      {
          price = Close[bar];
          value = price * (1 + WATR);
          trend = -1;
       }
    } else {
      if (trend <= 0) {
         if (Close[bar] < price) { price = Close[bar]; }
         value = price * (1 + WATR);
         if (Close[bar] > value)
         {
             price = Close[bar];
            value = price * (1 - WATR);
            trend = 1;
         }
      }
    }

   if (trend == -1) { Buffer1[bar]=value; }
   if (trend == 1) { Buffer2[bar]=value; }
//----

   bar--;
   }
   return(0);
  }
//+------------------------------------------------------------------+
Comments