Butterfly
Download script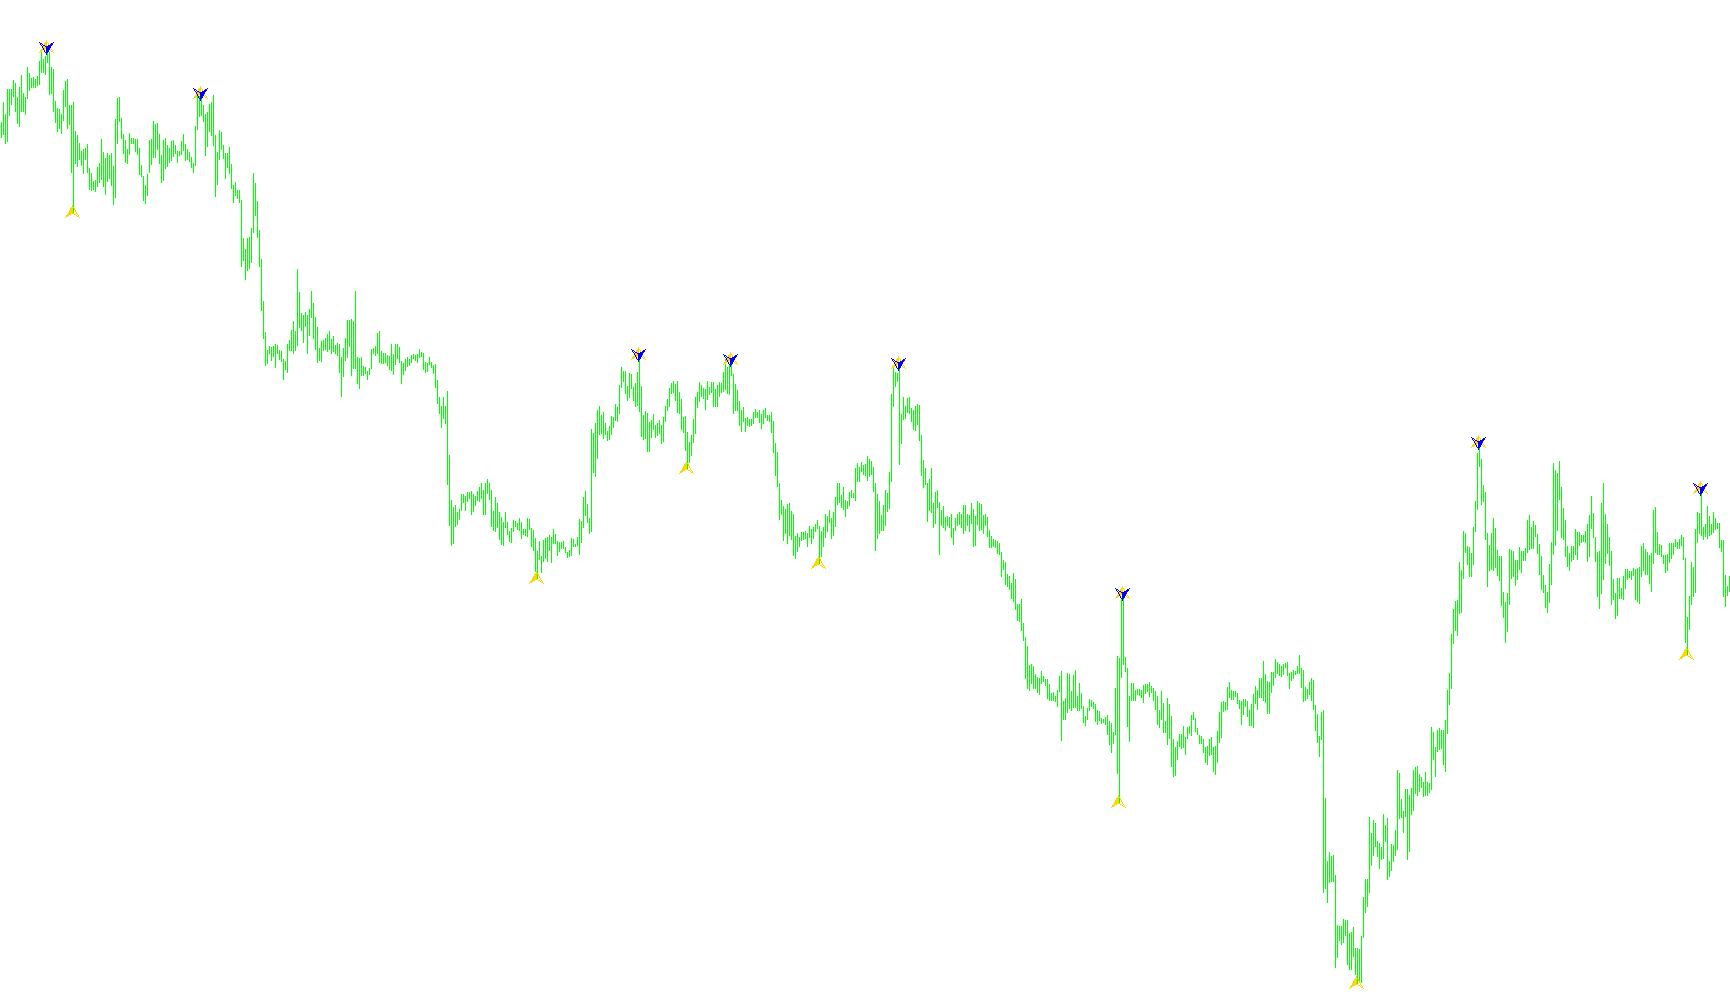
This script functions as a visual price tracking tool designed to identify and map out the significant structural "peaks" and "valleys" of a financial chart. Instead of showing every minor fluctuation in price, it filters out market noise to highlight the most important turning points, allowing traders to see the primary trend more clearly.
Core Logic and Behavior
The script operates through a multi-stage filtering process to ensure that only significant price movements are displayed on your screen:
1. Identification of Extremes The tool constantly scans the market history over a specific look-back period (defined by the "Depth" setting). It searches for the highest highs and lowest lows within this window. By doing this, it ignores small, insignificant price ticks and focuses only on the boundaries of current price action.
2. Noise Filtering and Sensitivity To prevent the chart from becoming cluttered with too many marks, the logic applies a "Deviation" filter. This ensures that a new peak or valley is only recorded if it moves a meaningful distance from the previous point. If a price movement is too small, the script treats it as insignificant noise and skips it.
3. Sequential Verification The tool uses a "backstep" logic to verify the validity of a price point. It looks at neighboring bars to ensure that the identified high or low is truly a distinct turning point relative to the candles immediately surrounding it. This helps in establishing a clean, jagged line of movement rather than a messy collection of dots.
4. Dynamic Peak/Valley Refinement One of the most sophisticated parts of this script is its ability to "self-correct" as new data comes in:
- High Point Correction: If the script identifies a peak, but a later price point appears that is even higher (within a specific sequence), it will "erase" the previous lower peak and update the visual to the new highest point.
- Low Point Correction: Conversely, if it identifies a valley but a subsequent lower price appears, it replaces the old low with the new one.
This ensures that the chart always reflects the most extreme points of the current market cycle.
Visual Output
The result is a set of clear visual markers:
- Highs (Peaks): Usually represented by marks indicating where the price reached a local maximum before retreating.
- Lows (Valleys): Represented by marks indicating where the price hit a local minimum before rebounding.
By connecting these dots mentally or visually, you can easily identify the "ZigZag" nature of the market—helping to see whether the price is currently in an uptrend, a downtrend, or moving sideways through a period of consolidation.
//+------------------------------------------------------------------+
//|                                                    Butterfly.mq4 |
//|                            Copyright © 2006, Archer Trading, LLC |
//|                                     http://www.archertrading.net |
//+------------------------------------------------------------------+
#property copyright "Copyright © 2006, Archer Trading, LLC"
#property link      "http://www.archertrading.net"

#property indicator_chart_window
#property indicator_buffers 2
#property indicator_color1 Lime
#property indicator_width1 3
#property indicator_color2 OrangeRed
#property indicator_width2 3
//---- indicator parameters
extern int ExtDepth=32;
extern int ExtDeviation=3;
extern int ExtBackstep=12;
//---- indicator buffers
double ExtMapBuffer[];
double ExtMapBuffer2[];

//+------------------------------------------------------------------+
//| Custom indicator initialization function                         |
//+------------------------------------------------------------------+
int init()
  {
   IndicatorBuffers(2);
//---- drawing settings
   SetIndexStyle(0,DRAW_ARROW,EMPTY,2);
   SetIndexArrow(0,217);
   SetIndexStyle(1,DRAW_ARROW,EMPTY,2);
   SetIndexArrow(1,218);

//---- indicator buffers mapping
   SetIndexBuffer(0,ExtMapBuffer);
   SetIndexBuffer(1,ExtMapBuffer2);
   SetIndexEmptyValue(0,0.0);
   ArraySetAsSeries(ExtMapBuffer,true);
   ArraySetAsSeries(ExtMapBuffer2,true);
//---- indicator short name
   IndicatorShortName("ZigZag("+ExtDepth+","+ExtDeviation+","+ExtBackstep+")");
//---- initialization done
   return(0);
  }
//+------------------------------------------------------------------+
//|                                                                  |
//+------------------------------------------------------------------+
int start()
  {
   int    shift, back,lasthighpos,lastlowpos;
   double val,res;
   double curlow,curhigh,lasthigh,lastlow;

   for(shift=Bars-ExtDepth; shift>=0; shift--)
     {
      val=Low[Lowest(NULL,0,MODE_LOW,ExtDepth,shift)];
      if(val==lastlow) val=0.0;
      else
        {
         lastlow=val;
         if((Low[shift]-val)>(ExtDeviation*Point)) val=0.0;
         else
           {
            for(back=1; back<=ExtBackstep; back++)
              {
               res=ExtMapBuffer[shift+back];
               if((res!=0)&&(res>val)) ExtMapBuffer[shift+back]=0.0;
              }
           }
        }
      ExtMapBuffer[shift]=val;
      //--- high
      val=High[Highest(NULL,0,MODE_HIGH,ExtDepth,shift)];
      if(val==lasthigh) val=0.0;
      else
        {
         lasthigh=val;
         if((val-High[shift])>(ExtDeviation*Point)) val=0.0;
         else
           {
            for(back=1; back<=ExtBackstep; back++)
              {
               res=ExtMapBuffer2[shift+back];
               if((res!=0)&&(res<val)) ExtMapBuffer2[shift+back]=0.0;
              }
           }
        }
      ExtMapBuffer2[shift]=val;
     }

   // final cutting
   lasthigh=-1; lasthighpos=-1;
   lastlow=-1;  lastlowpos=-1;

   for(shift=Bars-ExtDepth; shift>=0; shift--)
     {
      curlow=ExtMapBuffer[shift];
      curhigh=ExtMapBuffer2[shift];
      if((curlow==0)&&(curhigh==0)) continue;
      //---
      if(curhigh!=0)
        {
         if(lasthigh>0)
           {
            if(lasthigh<curhigh) ExtMapBuffer2[lasthighpos]=0;
            else ExtMapBuffer2[shift]=0;
           }
         //---
         if(lasthigh<curhigh || lasthigh<0)
           {
            lasthigh=curhigh;
            lasthighpos=shift;
           }
         lastlow=-1;
        }
      //----
      if(curlow!=0)
        {
         if(lastlow>0)
           {
            if(lastlow>curlow) ExtMapBuffer[lastlowpos]=0;
            else ExtMapBuffer[shift]=0;
           }
         //---
         if((curlow<lastlow)||(lastlow<0))
           {
            lastlow=curlow;
            lastlowpos=shift;
           }
         lasthigh=-1;
        }
     }

   for(shift=Bars-1; shift>=0; shift--)
     {
      if(shift>=Bars-ExtDepth) ExtMapBuffer[shift]=0.0;
      else
        {
         res=ExtMapBuffer2[shift];
         if(res!=0.0) ExtMapBuffer[shift]=res;
        }
     }
  }
Comments