Bulls Bears Power
Download script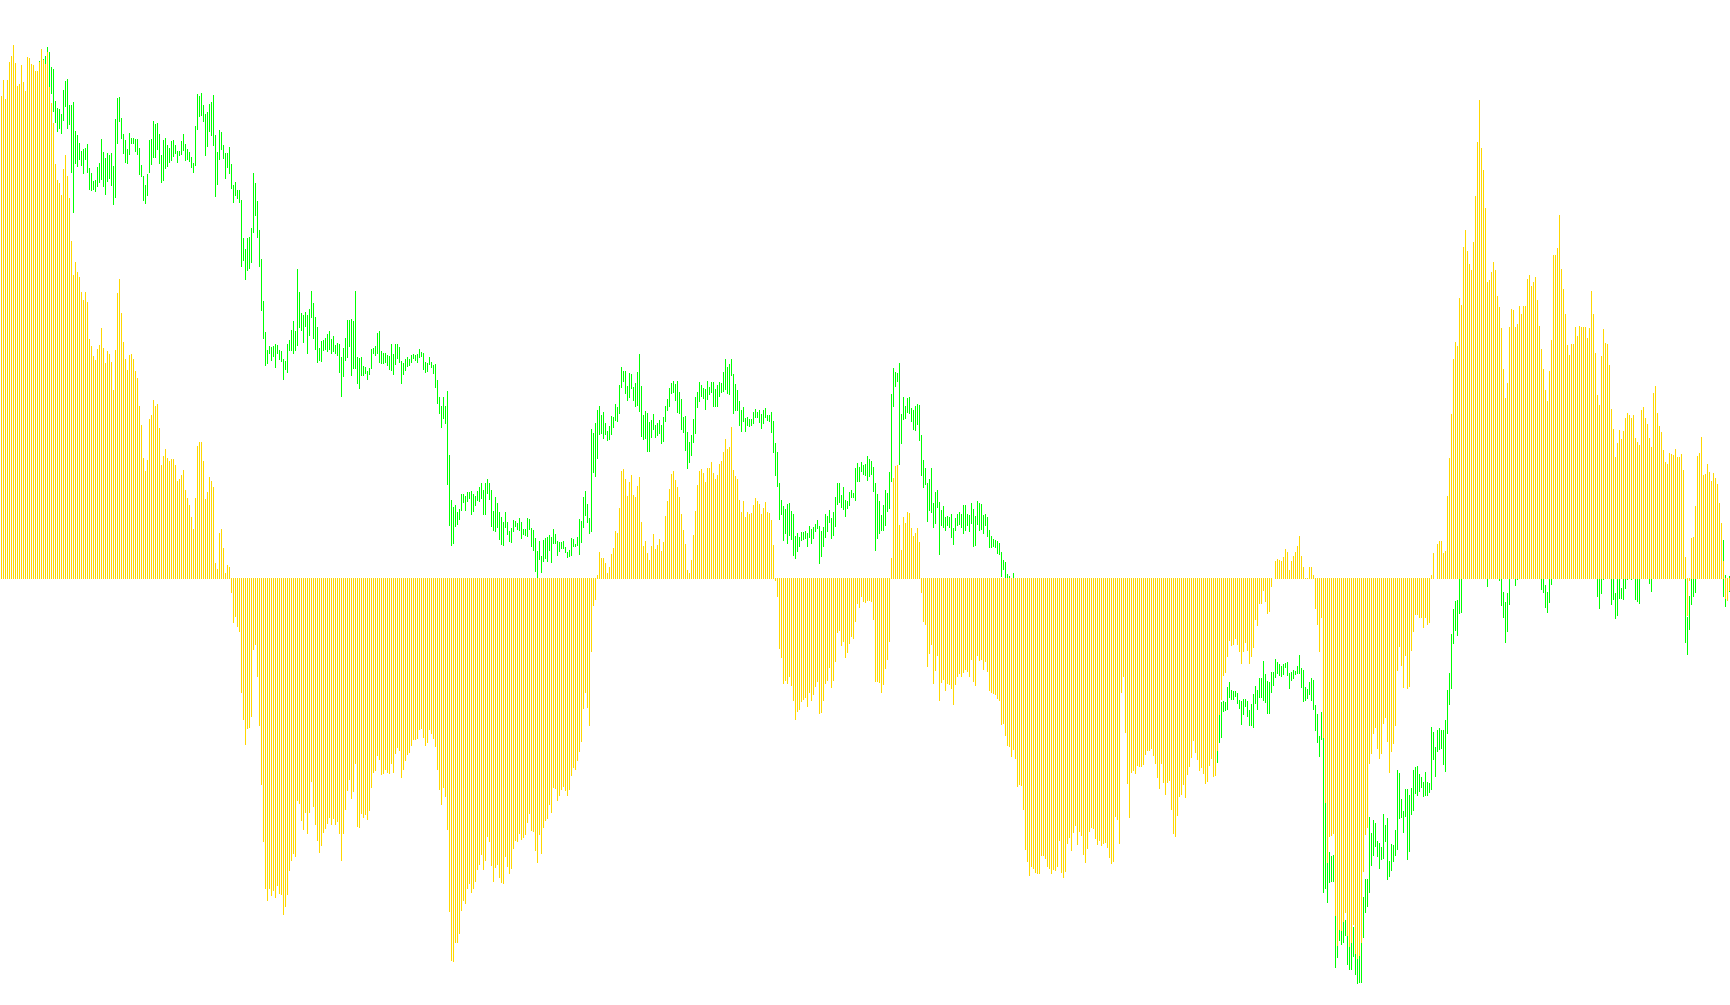
This tool, titled Bulls Bears Power, is designed to provide traders with a visual representation of market momentum by measuring the distance between current price extremes and a smoothed average of those prices.
Instead of looking at just one price point, the indicator analyzes the relationship between the "highs" and "lows" of a specific timeframe to determine how much strength there is behind the current market move. Here is a breakdown of how it works:
Core Logic
The indicator functions by comparing the total range of a candle (the distance from its highest point to its lowest point) against a moving average baseline.
- Establishing the Baseline: The script calculates a "Moving Average" based on a user-defined period (defaulting to 155). This acts as the "equilibrium" or the fair value of the asset over that duration.
- Calculating the Deviation: For every price bar, the tool takes the sum of the High and Low prices and subtracts twice the moving average. Essentially, it is measuring how far the current price action is stretching away from its historical average.
- Visualizing Momentum: The result is plotted as a histogram in a separate window below your main chart.
How to Interpret the Results
- Bullish Strength: When the histogram moves significantly above the zero line, it indicates that the "Highs" are pushing aggressively upward relative to the average, suggesting strong buying pressure (Bulls).
- Bearish Strength: When the histogram drops significantly below the zero line, it suggests that the "Lows" are pulling downward with force relative to the average, indicating dominant selling pressure (Bears).
- Market Neutrality: When the histogram is hugging or crossing the zero line, it suggests that the market is moving in line with its historical average, often indicating a period of consolidation or lack of clear direction.
By using this indicator, you can more easily identify when a trend is gaining real power or when a move is starting to exhaust itself by comparing the current price "stretch" against the long-term historical norm.
//+------------------------------------------------------------------+
//|                                            Bulls Bears Power.mq4 |
//|                                                   vasbsm@mail.ru |
//|                                                                  |
//+------------------------------------------------------------------+
#property copyright "vasbsm@mail.ru"
#property link      ""

#property indicator_separate_window
#property indicator_buffers 1
#property indicator_color1 Silver
//---- input parameters
extern int       BBPeriod=155;
extern int       TypeMA=0;
//-----------------------------
double BBBuffer[];
double TempBuffer[];
int init()
  {
   string short_name;
   IndicatorBuffers(2);
   IndicatorDigits(Digits);
   SetIndexStyle(0,DRAW_HISTOGRAM);
   SetIndexBuffer(0,BBBuffer);
   SetIndexBuffer(1,TempBuffer);
   short_name="Bulls Bears Power("+BBPeriod+")";
   IndicatorShortName(short_name);
   SetIndexLabel(0,short_name);
   return(0);
  }
int deinit()
  {

   return(0);
  }
int start()
  {
   int counted_bars=IndicatorCounted();
   if(Bars<=BBPeriod) return(0);
//----------------------------------------------------------------
   int limit=Bars-counted_bars;
   if(counted_bars>0) limit++;
   for(int i=0; i<limit; i++)
      TempBuffer[i]=iMA(NULL,0,BBPeriod,0,TypeMA,PRICE_CLOSE,i);
//----------------------------------------------------------------
   i=Bars-counted_bars-1;
   while(i>=0)
     {
      BBBuffer[i]=High[i]+Low[i]-2*TempBuffer[i];
      i--;
     }
   return(0);
  }
Comments