Indicator

Candle_Patterns

iMA
Indicator

Candle_Signal

iMA
Indicator

Candle_Signal_v2

iMA
CandRelation_v2
Indicator

CandRelation_v2

This indicator quantifies the relative proportions of upper shadow, real body, and lower shadow as percentage components of the total candle range.

CAO
Indicator

CAO

iMA

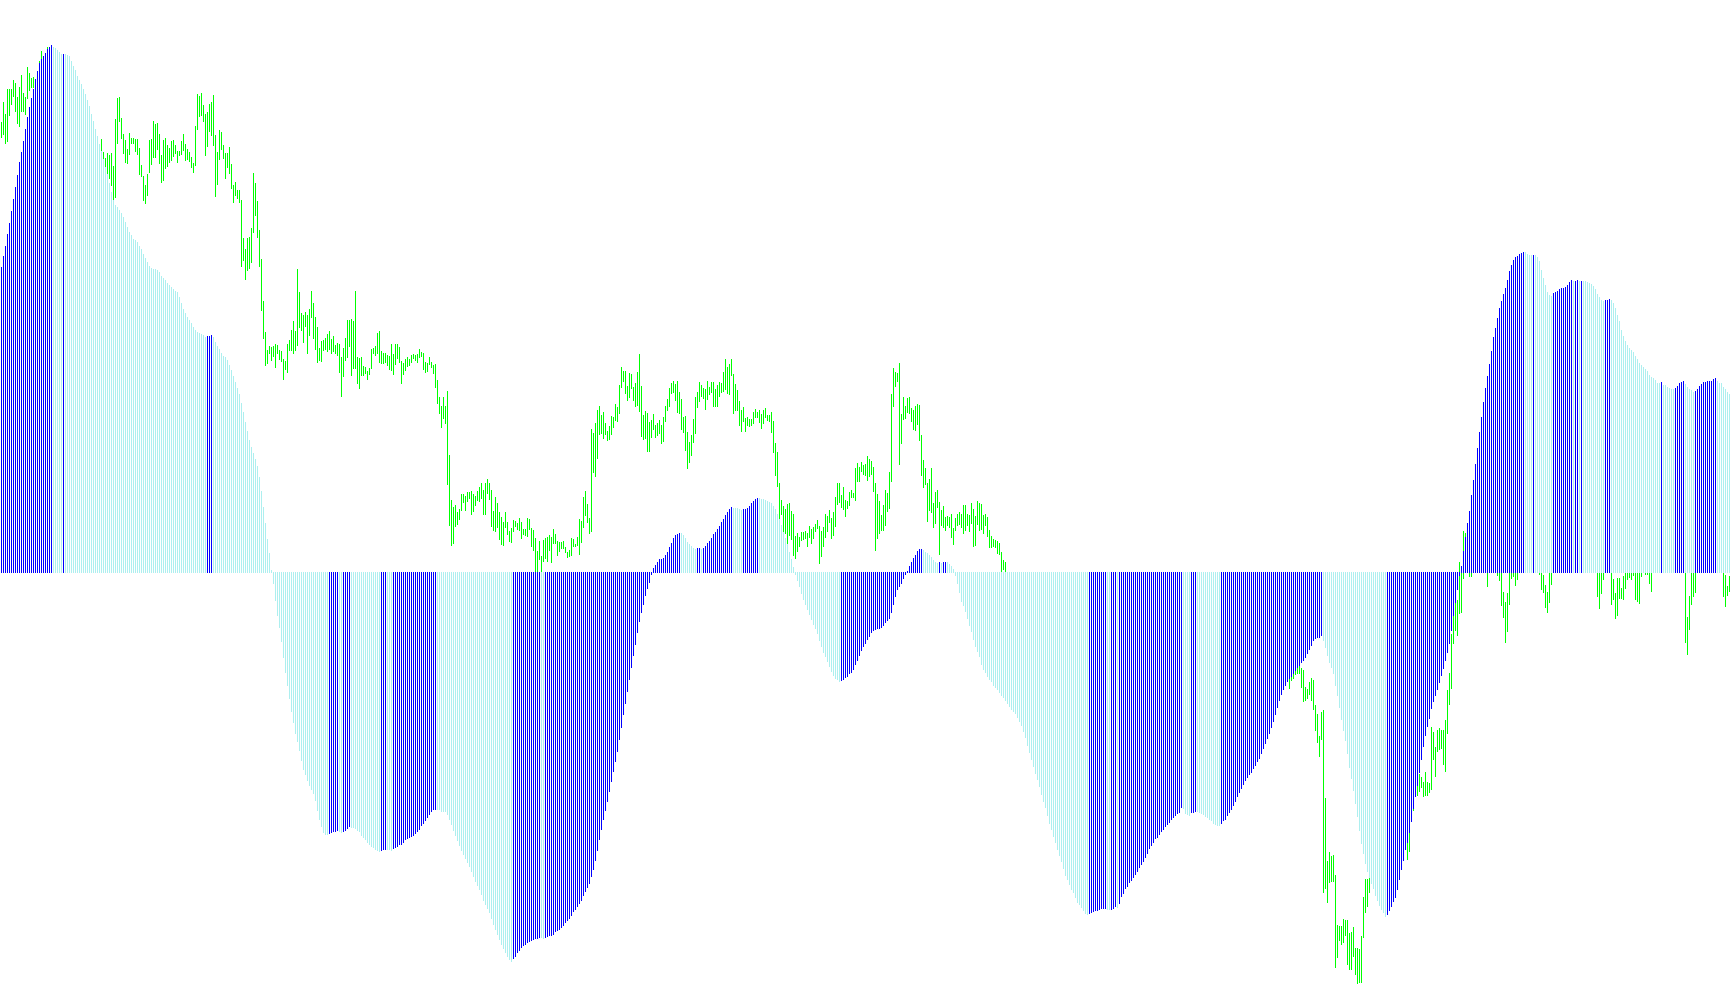
This indicator calculates the difference between two simple moving averages to generate a color-coded histogram that visually distinguishes increasing and decreasing price momentum.

carmens_eyes_v1.03
Indicator

carmens_eyes_v1.03

iMA

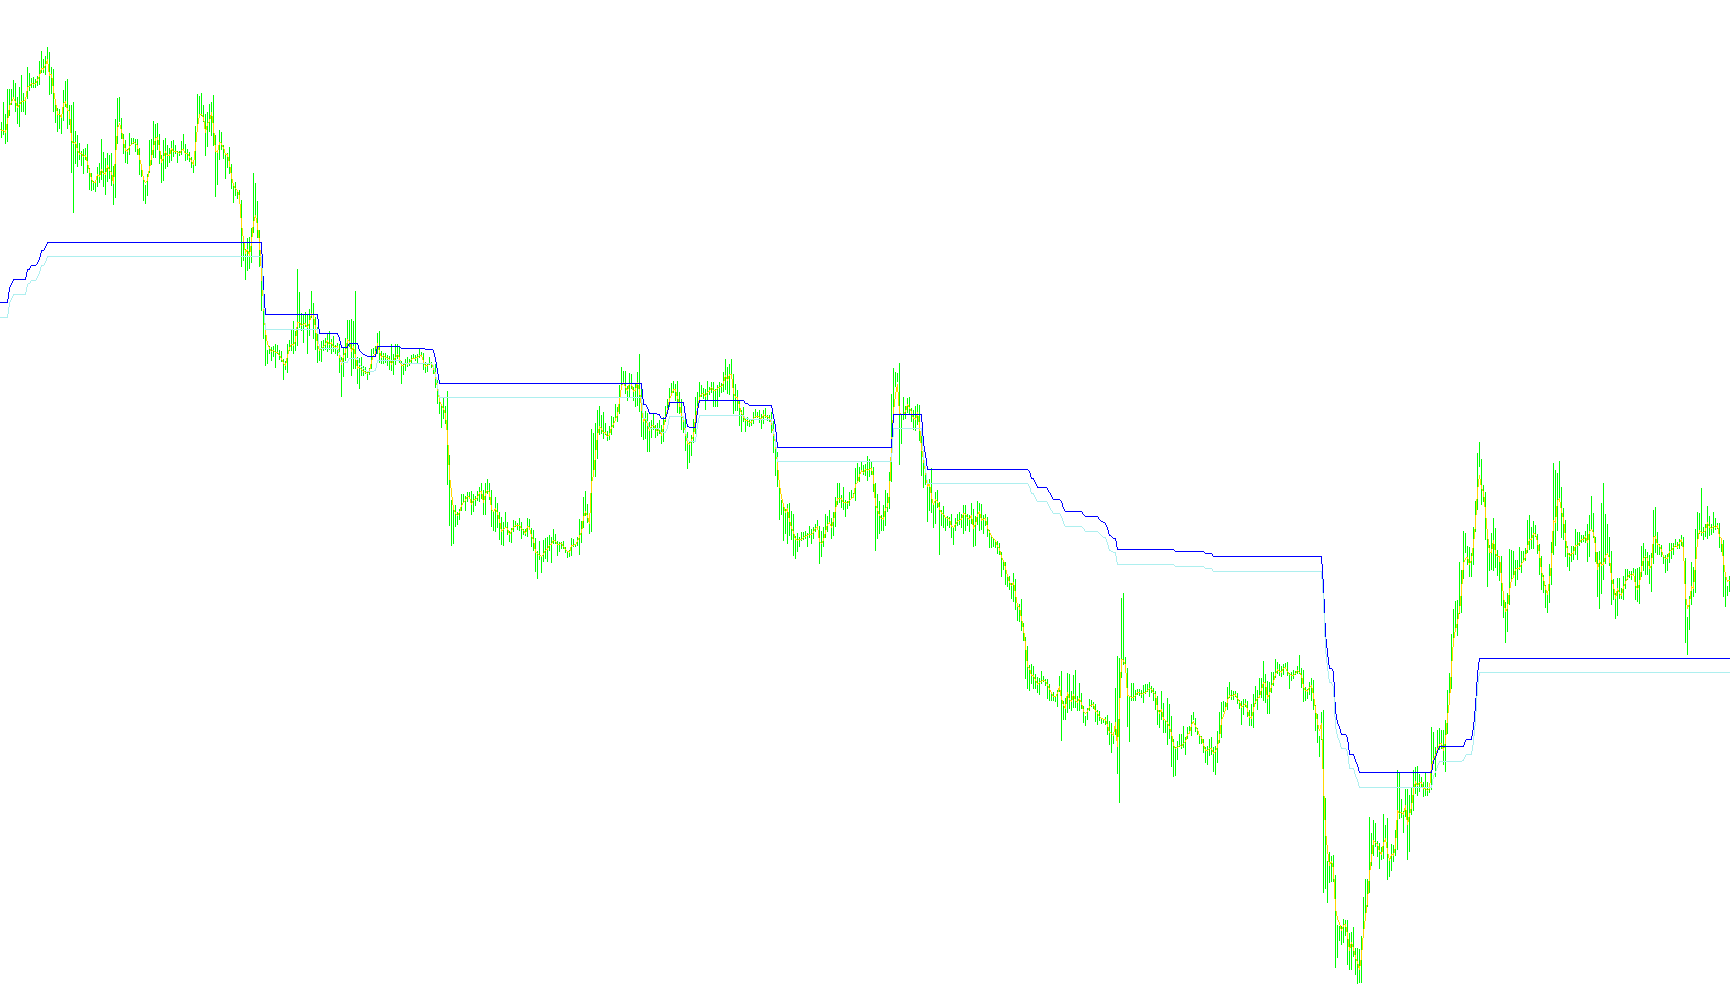
This indicator identifies trend reversals by monitoring price excursions beyond adaptive exponential moving average boundaries that expand dynamically based on real-time trade state and distance thresholds.

Carter_MA
Indicator

Carter_MA

iMA

This indicator overlays five distinct Exponential Moving Averages with periods of 8, 21, 50, 100, and 200 to visualize multi-timeframe trend dynamics.

Indicator

CatFX50

iATRiMA
Indicator

CatFX50b

iATRiMA
Indicator

CatFX50b_v1

iATRiMA
CatFx50K
Indicator

CatFx50K

iMA

This indicator identifies high-probability entry points by synchronizing dual stochastic oscillator crossovers with Exponential Moving Average price action and custom inverse trend volatility filters.

Indicator

CatFX50_last ver

iATRiMA
Indicator

CatFX50_last ver_v1

iATRiMA
Indicator

CatFX50_nk

iATRiMA
Indicator

CatFX50_v1

iATRiMA
Indicator

CatFX50_v2

iATRiMA
CC
Indicator

CC

iMA

This indicator calculates and visualizes the real-time price dynamics between multiple major currency pairs by synthesizing weighted moving average differentials into a unified correlation overview.

CCFp
Indicator

CCFp

iMA

This indicator visualizes the relative strength and dynamic interaction between major forex pairs by calculating differential ratios of fast and slow moving averages.

CCFp_Close_v1[1].1vert
Indicator

CCFp_Close_v1[1].1vert

This indicator quantifies the relative momentum and cross-currency strength of major forex pairs by calculating percentage price deviations across a multi-currency basket.

CCFp_v1
Indicator

CCFp_v1

iMA

This indicator calculates the relative divergence between multiple currency pairs using smoothed moving average ratios to visualize cross-asset momentum and lead-lag relationships.

CCFp_v1[1].0.2
Indicator

CCFp_v1[1].0.2

iMA

This indicator calculates and visualizes the relative price velocity of major forex pairs by comparing weighted moving average deviations across a diversified currency basket.

CCFp_v1[1].0.2a
Indicator

CCFp_v1[1].0.2a

iMA

This indicator calculates the relative momentum of major fiat currencies by synthesizing moving average deviations across multiple currency pairs to visualize instantaneous directional strength.

CCFp_v1[1].0.2b
Indicator

CCFp_v1[1].0.2b

iMA

This indicator quantifies the interdependency of major forex pairs by calculating weighted relative strength movements across a diverse basket of currencies simultaneously.

CCFp_v1[1].0.2bvert
Indicator

CCFp_v1[1].0.2bvert

iMA

This indicator calculates the relative strength and momentum of major global currencies by analyzing price velocity differentials across multiple currency pairs simultaneously.

CCFp_v1[1].0.2cvert
Indicator

CCFp_v1[1].0.2cvert

iMA

This indicator calculates and visualizes the relative strength differentials between major global currencies by comparing moving average ratios across a multi-pair synthetic matrix.

CCFp_v1[1].0.3cvert
Indicator

CCFp_v1[1].0.3cvert

iMA

This indicator calculates and visualizes the relative strength and moving average deviations of major currency pairs to identify cross-market correlations.

CCFp_v1[1].0.3dvert
Indicator

CCFp_v1[1].0.3dvert

iMA

This indicator calculates and visualizes the relative price velocity of major currencies by aggregating the percentage change between specific currency pairs to identify leading market strengths.

CCI 8
Indicator

CCI 8

iCCI

This indicator applies a Triple Exponential (T3) smoothing algorithm to the Commodity Channel Index to filter market noise and identify sustained momentum shifts.

Indicator

CCI CustomCandles-MTF

iCCI
CCI CustomCandles
Indicator

CCI CustomCandles

iCCI

This indicator dynamically recolors chart candles based on the Commodity Channel Index exceeding pre-defined overbought and oversold thresholds to highlight momentum extremes.

CCI CustomCandles_v1
Indicator

CCI CustomCandles_v1

iCCI

This indicator dynamically recolors chart candles to highlight price action occurring during extreme overbought and oversold momentum states identified by the Commodity Channel Index.

Indicator

cci hist_EMA_COL

iCCIiMAOnArray
CCI woodies
Indicator

CCI woodies

iCCI

This indicator utilizes dual Commodity Channel Index (CCI) calculations to identify directional momentum and visualize prevailing trend bias through multi-bar histogram overlays.

CCI-alert
Indicator

CCI-alert

iCCI

This indicator categorizes price momentum into trend intensities and provides real-time alerts on zero-line crossings, trigger threshold breaches, and extreme overextended zones.

CCI-alert_mtf
Indicator

CCI-alert_mtf

iCCI

This multi-timeframe indicator identifies momentum shifts and trend intensity by monitoring CCI excursions beyond specific trigger thresholds and zero-cross boundaries.

CCI-alert_mtf_001
Indicator

CCI-alert_mtf_001

iCCI

This multi-timeframe indicator identifies trend strength and momentum shifts by monitoring Commodity Channel Index (CCI) breaches of zero, trigger, and critical threshold levels.

CCI
Indicator

CCI

iMA

Quantifies the current price's distance from a rolling average relative to the mean absolute deviation of the typical price.

Indicator

CCIALERT

iCCI
Indicator

CCIALERT_v1

iCCI
CCIarrow
Indicator

CCIarrow

iCCI

Identifies trend reversal points by detecting instances where the Commodity Channel Index crosses the zero equilibrium level.

CCIAverage
Indicator

CCIAverage

iMA

This indicator calculates the Commodity Channel Index and applies a Simple Moving Average to its values to filter out high-frequency noise and identify trend momentum.

CCIFilter vX
Indicator

CCIFilter vX

iCCI

This indicator categorizes market momentum into four distinct trend intensities based on Commodity Channel Index thresholds while providing visual signals for zero-line crossovers and critical volatility breaches.

CCIFilterv0.2
Indicator

CCIFilterv0.2

iCCI

Classifies market momentum into four distinct states—strong bullish, mild bullish, mild bearish, and strong bearish—by evaluating Commodity Channel Index values against zero and extreme trigger thresholds.

CCIFilterv0[1].1
Indicator

CCIFilterv0[1].1

iCCI

This indicator categorizes market sentiment into four distinct states by analyzing the Commodity Channel Index to differentiate between aggressive trend strength and mild directional bias.

Indicator

CCIFilter_Email

iCCI
CCIFilter_vX(2)
Indicator

CCIFilter_vX(2)

iCCI

This indicator categorizes market sentiment into distinct trend intensities by evaluating Commodity Channel Index levels against specific zero, trigger, and critical thresholds.

CCIRSIDOT
Indicator

CCIRSIDOT

iCCIiRSI

This indicator identifies trend shifts by detecting RSI zero-line equilibrium crossings while monitoring CCI momentum threshold breaches for entry signals.

CCIRSIDOT_v1
Indicator

CCIRSIDOT_v1

iCCIiRSI

This indicator identifies trend transitions by detecting RSI zero-line momentum shifts in conjunction with CCI threshold breaches.

CCISqueeze
Indicator

CCISqueeze

iATRiMAiStdDev

This indicator identifies market compression by measuring the ratio between Bollinger Band width and Keltner Channel range, overlaid with a Commodity Channel Index (CCI) momentum histogram.

cci_AdaptiveCyberCycle00test02
Indicator

cci_AdaptiveCyberCycle00test02

iCCI

This indicator dynamically calculates a modified Commodity Channel Index by integrating a self-adjusting period derived from cybernetic cycle analysis of price midpoint fluctuations.