BullsBears_ma_sigma
Download script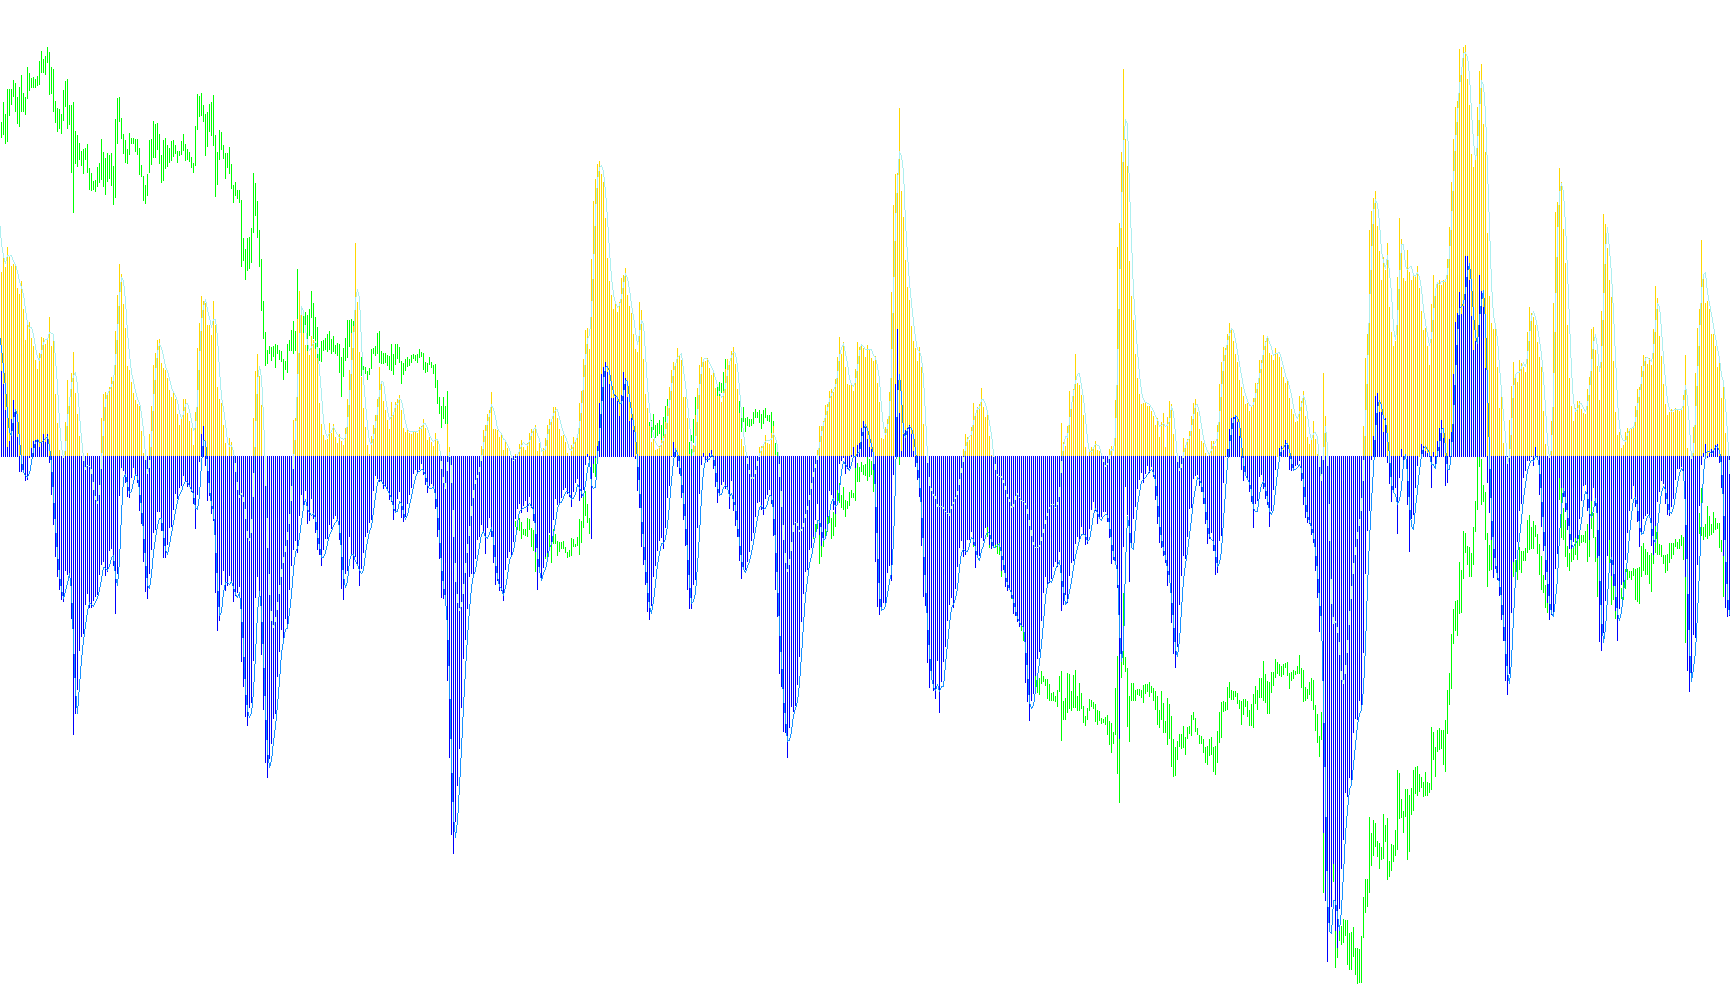
This tool is designed to provide traders with a visual representation of market momentum by distinguishing between the strength of "Bulls" (buyers) and "Bears" (sellers). Instead of just looking at price, it analyzes the relationship between price extremes and moving averages to identify who is currently controlling the market.
How the Logic Works
The script operates through a multi-step calculation process to filter out market noise and highlight significant trends:
1. Establishing the Baseline The tool first calculates a baseline using an Exponential Moving Average (EMA) based on the closing prices over a specific period. This acts as a "smoothed" version of the market's general direction, providing a steady reference point for all further calculations.
2. Measuring Buyer and Seller Strength Rather than looking at where the price finishes (the close), the tool looks at the highest and lowest points reached during trading sessions:
- Bullish Momentum: It calculates the difference between the average high prices and the baseline. A higher value here suggests that buyers are pushing the price aggressively toward the upper limits.
- Bearish Momentum: It calculates the difference between the average low prices and the baseline. This helps identify how strongly sellers are driving the price toward the bottom.
The result is visualized as a histogram, allowing you to see at a glance which side of the market holds the most power at any given moment.
3. Smoothing the Signal To prevent traders from reacting to minor, momentary fluctuations (market "jitter"), the script applies an additional layer of smoothing to both the Bull and Bear readings. This creates a "Signal" line that follows the broader trend of the momentum.
Visual Interpretation
The indicator provides four distinct visual elements:
- Histograms: These represent the raw intensity of buying and selling pressure. They grow larger as the dominance of one side increases.
- Signal Lines: These provide a smoothed path for both Bull and Bear strength, making it easier to identify sustained shifts in market sentiment rather than temporary spikes.
By observing the interplay between these histograms and signal lines, you can more easily perceive whether the market is trending strongly in one direction or if the forces of buyers and sellers are currently balanced.
//+------------------------------------------------------------------+
//|                                                        Bulls.mq4 |
//|                      Copyright © 2005, MetaQuotes Software Corp. |
//|                                       http://www.metaquotes.net/ |
//+------------------------------------------------------------------+
//mod
#property copyright "Copyright © 2005, MetaQuotes Software Corp."
#property link      "http://www.metaquotes.net/"

#property indicator_separate_window
#property indicator_buffers 4
#property indicator_color1 DarkGreen
#property indicator_color2 Maroon
#property indicator_color3 Blue
#property indicator_color4 DarkOrange
#property indicator_width1 2
#property indicator_style3 2
#property indicator_style4 2

//---- input parameters
extern int BullsBearsPeriod=13;
extern int BullsBearsMAPeriod=5;
extern int SignalSMA=3;
//---- buffers
double BullsBuffer[];
double BearsBuffer[];
double BullsSignal[];
double BearsSignal[];
double TempBuffer[];
//+------------------------------------------------------------------+
//| Custom indicator initialization function                         |
//+------------------------------------------------------------------+
int init()
  {
   string short_name;
//---- 1 additional buffer used for counting.
   IndicatorBuffers(5);
   IndicatorDigits(Digits);
//---- indicator line
   SetIndexStyle(0,DRAW_HISTOGRAM);
   SetIndexStyle(1,DRAW_HISTOGRAM);
   SetIndexStyle(2,DRAW_LINE);
   SetIndexStyle(3,DRAW_LINE);
   SetIndexBuffer(0,BullsBuffer);
   SetIndexBuffer(1,BearsBuffer);
   SetIndexBuffer(2,BullsSignal);
   SetIndexBuffer(3,BearsSignal);
   SetIndexBuffer(4,TempBuffer);
//---- name for DataWindow and indicator subwindow label
   short_name="BullsBears ("+BullsBearsPeriod+") ma "+BullsBearsMAPeriod;
   IndicatorShortName(short_name);
   SetIndexLabel(0,short_name);
//----
   return(0);
  }
//+------------------------------------------------------------------+
//| Bulls Power                                                      |
//+------------------------------------------------------------------+
int start()
  {
   int i,counted_bars=IndicatorCounted();
//----
   if(Bars<=BullsBearsPeriod) return(0);
//----
   int limit=Bars-counted_bars;
   if(counted_bars>0) limit++;
   for(i=0; i<limit; i++)
      TempBuffer[i]=iMA(NULL,0,BullsBearsPeriod,0,MODE_EMA,PRICE_CLOSE,i);
//----
   i=Bars-counted_bars-1;
   while(i>=0)
     {
      BullsBuffer[i]=iMA(NULL,0,BullsBearsMAPeriod,0,MODE_EMA,PRICE_HIGH,i)-TempBuffer[i];
      BearsBuffer[i]=iMA(NULL,0,BullsBearsMAPeriod,0,MODE_EMA,PRICE_LOW,i) -TempBuffer[i];


      i--;
     }

     //----
   i=Bars-counted_bars-1;
   while(i>=0)
     {
      BullsSignal[i]=iMAOnArray(BullsBuffer,Bars,SignalSMA,0,MODE_SMA,i);
      BearsSignal[i]=iMAOnArray(BearsBuffer,Bars,SignalSMA,0,MODE_SMA,i);
      i--;
     }
//----
   return(0);
  }
//+------------------------------------------------------------------+
Comments