BT1
Download script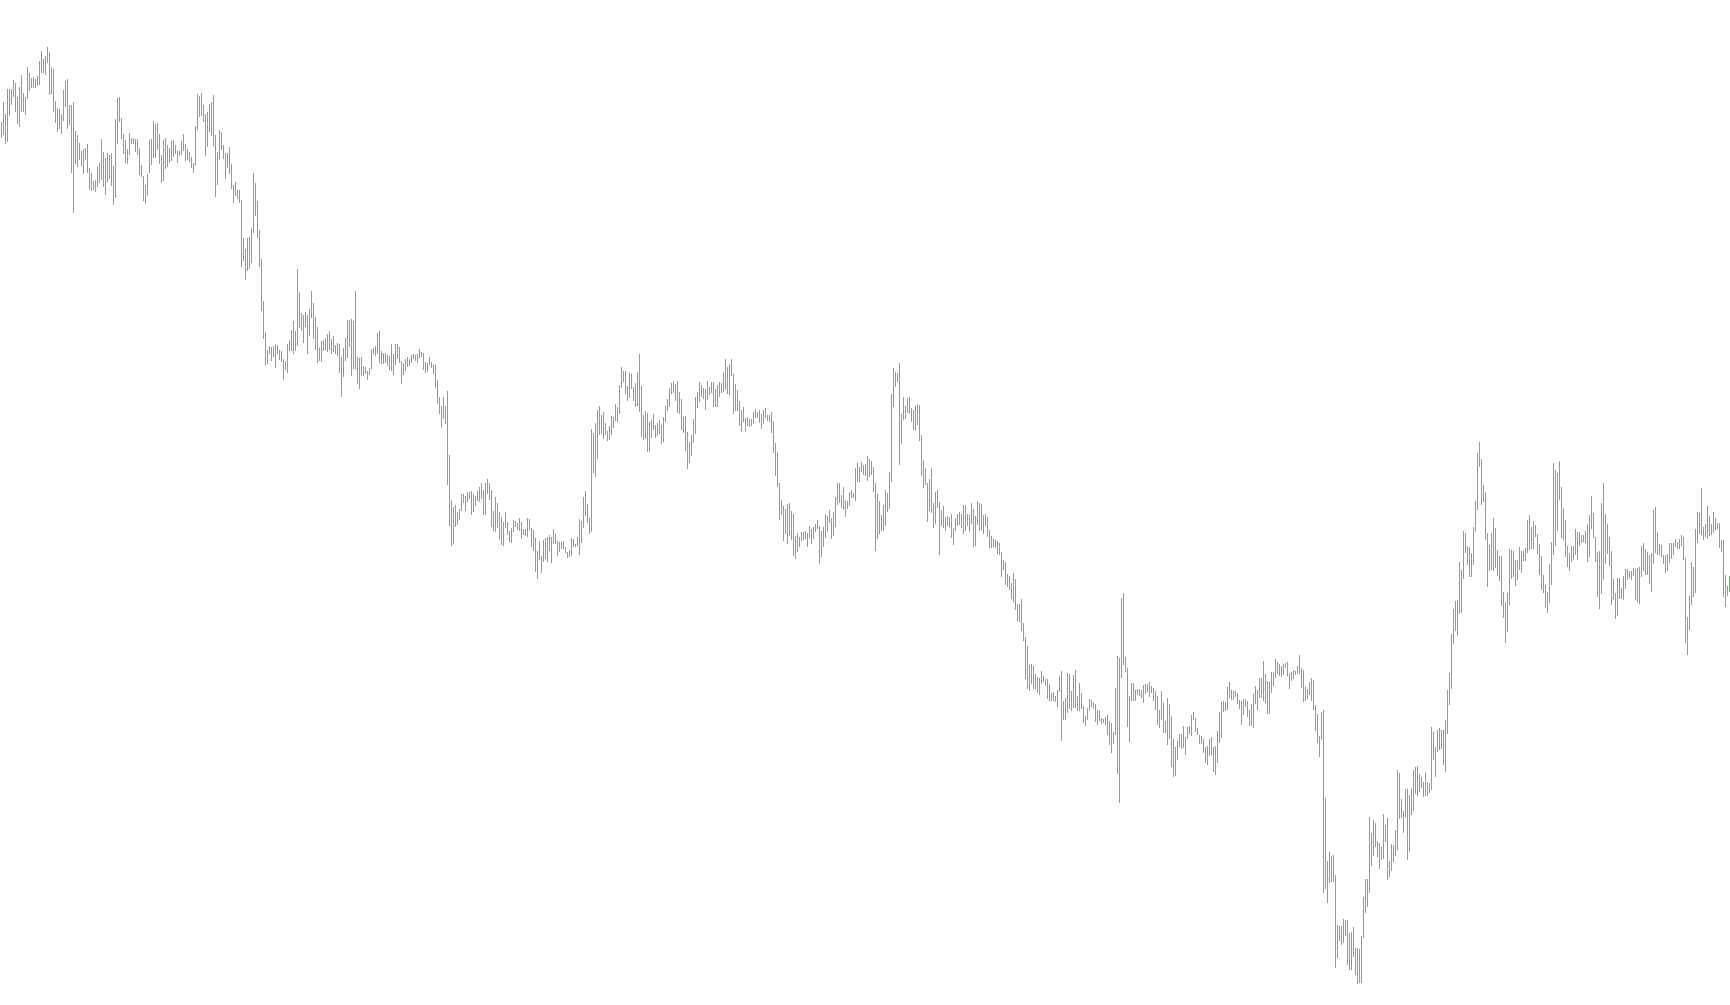
This tool is designed to analyze market trends by identifying significant price movements and filtering out "noise" to provide clearer visual signals on a trading chart. Instead of simply following every small fluctuation in price, the script evaluates the intensity and momentum of the market to determine the prevailing direction.
Core Logic and Methodology
The script functions by examining a specific window of recent historical data (the number of bars) to calculate several key metrics:
1. Volatility Measurement First, the tool calculates the average range of price movement over a 10-bar period. By determining the difference between the highest and lowest prices during this time, it establishes a "baseline" for how much the market is currently moving.
2. Trend Strength Verification The logic then looks for two specific types of "breakout" behaviors to confirm that a trend is genuine:
- Gap/Jump Detection: It searches for instances where the price opens significantly higher or lower than the previous close relative to the average range.
- Momentum Analysis: It checks if the price has moved a substantial distance over a short period (specifically looking for a jump of nearly 5 times the average range).
If the market meets these specific criteria, the script recognizes a "True Count"—meaning it confirms that a significant move is occurring rather than just random minor fluctuations.
3. Dynamic Adjustment The script uses a dynamic calculation to adjust its sensitivity. If a significant trend is detected, it modifies its internal settings to react more quickly to the current momentum. If no significant movement is detected, it defaults to a more conservative state to avoid giving false signals during flat markets.
4. Signal Generation Finally, the tool combines these observations with a "Williams Percent Range" calculation—a mathematical way to determine where the current price sits relative to its recent high and low points.
- Bullish Signals: When the momentum is strongly positive and exceeds a high threshold, the tool identifies an upward trend.
- Bearish Signals: When the momentum is strongly negative and falls below a low threshold, it identifies a downward trend.
Visual Output
The script represents these findings as two distinct histogram lines (Red and Blue). By comparing the position of these lines against the high and low prices of the candles, traders can visually distinguish between periods of strong upward pressure and periods of heavy downward momentum.
//+-----------------------------------------------------------------------+
//|                                                       BrainTrend1.mq4 |
//|                                   Copyright © 2005. Alejandro Galindo |
//|                                                   http://elCactus.com |
//|         ASCTrend1 modified to generate similar signals to BrainTrend1 |
//|           	Author := C0Rpus - big thanks CHANGE2002, STEPAN and SERSH |
//|	                                 Notes := ASCTrend1 3.0 Open Source |
//+-----------------------------------------------------------------------+

#property indicator_chart_window
#property indicator_buffers 2
#property indicator_color1 Red
#property indicator_color2 Blue

//---- input parameters
extern int RISK=3;
extern int CountBars=500;

//---- buffers
double Buffer1[];
double Buffer2[];

//+------------------------------------------------------------------+
//| Custom indicator initialization function                         |
//+------------------------------------------------------------------+
int init()
  {
//---- indicator line
   IndicatorBuffers(2);
   SetIndexStyle(0,DRAW_HISTOGRAM,0,1);
   SetIndexStyle(1,DRAW_HISTOGRAM,0,1);
   SetIndexBuffer(0,Buffer1);
   SetIndexBuffer(1,Buffer2);

//----
   return(0);
  }
//+------------------------------------------------------------------+
//| ASCTrend1                                                  |
//+------------------------------------------------------------------+
int start()
  {
   if (CountBars>=Bars) CountBars=Bars;
   SetIndexDrawBegin(0,Bars-CountBars+11+1);
   SetIndexDrawBegin(1,Bars-CountBars+11+1);
   int i,shift,counted_bars=IndicatorCounted();
   int Counter,i1,value10,value11;
   double value1,x1,x2;
   double value2,value3;
   double TrueCount,Range,AvgRange,MRO1,MRO2;

   value10=3+RISK*2;
   x1=67+RISK;
   x2=33-RISK;
   value11=value10;
//----
   if(Bars<=value11+1) return(0);
//---- initial zero
   if(counted_bars<value11+1)
   {
      for(i=1;i<=0;i++) Buffer1[CountBars-i]=0.0;
      for(i=1;i<=0;i++) Buffer2[CountBars-i]=0.0;
   }
//----
   shift=CountBars-11-1;
   while(shift>=0)
     {

   Counter=shift;
	Range=0.0;
	AvgRange=0.0;
	for (Counter=shift; Counter<=shift+9; Counter++) AvgRange=AvgRange+MathAbs(High[Counter]-Low[Counter]);

	Range=AvgRange/10;
	Counter=shift;
	TrueCount=0;
	while (Counter<shift+9 && TrueCount<1)
		{if (MathAbs(Open[Counter]-Close[Counter+1])>=Range*2.0) TrueCount=TrueCount+1;
		Counter=Counter+1;
		}
	if (TrueCount>=1) {MRO1=Counter;} else {MRO1=-1;}
	Counter=shift;
	TrueCount=0;
	while (Counter<shift+6 && TrueCount<1)
		{if (MathAbs(Close[Counter+3]-Close[Counter])>=Range*4.6) TrueCount=TrueCount+1;
		Counter=Counter+1;
		}
	if (TrueCount>=1) {MRO2=Counter;} else {MRO2=-1;}
	if (MRO1>-1) {value11=3;} else {value11=value10;}
	if (MRO2>-1) {value11=4;} else {value11=value10;}
	value2=100-MathAbs(iWPR(NULL,0,value11,shift)); // PercentR(value11=9)
   Buffer1[shift]=0;
	Buffer2[shift]=0;
	if (value2>x1)
		{
		Buffer1[shift]=Low[shift]; Buffer2[shift]=High[shift];
		}
	if (value2<x2)
		{
		Buffer1[shift]=High[shift]; Buffer2[shift]=Low[shift];
		}

      shift--;
     }

   return(0);
  }
//+------------------------------------------------------------------+
Comments