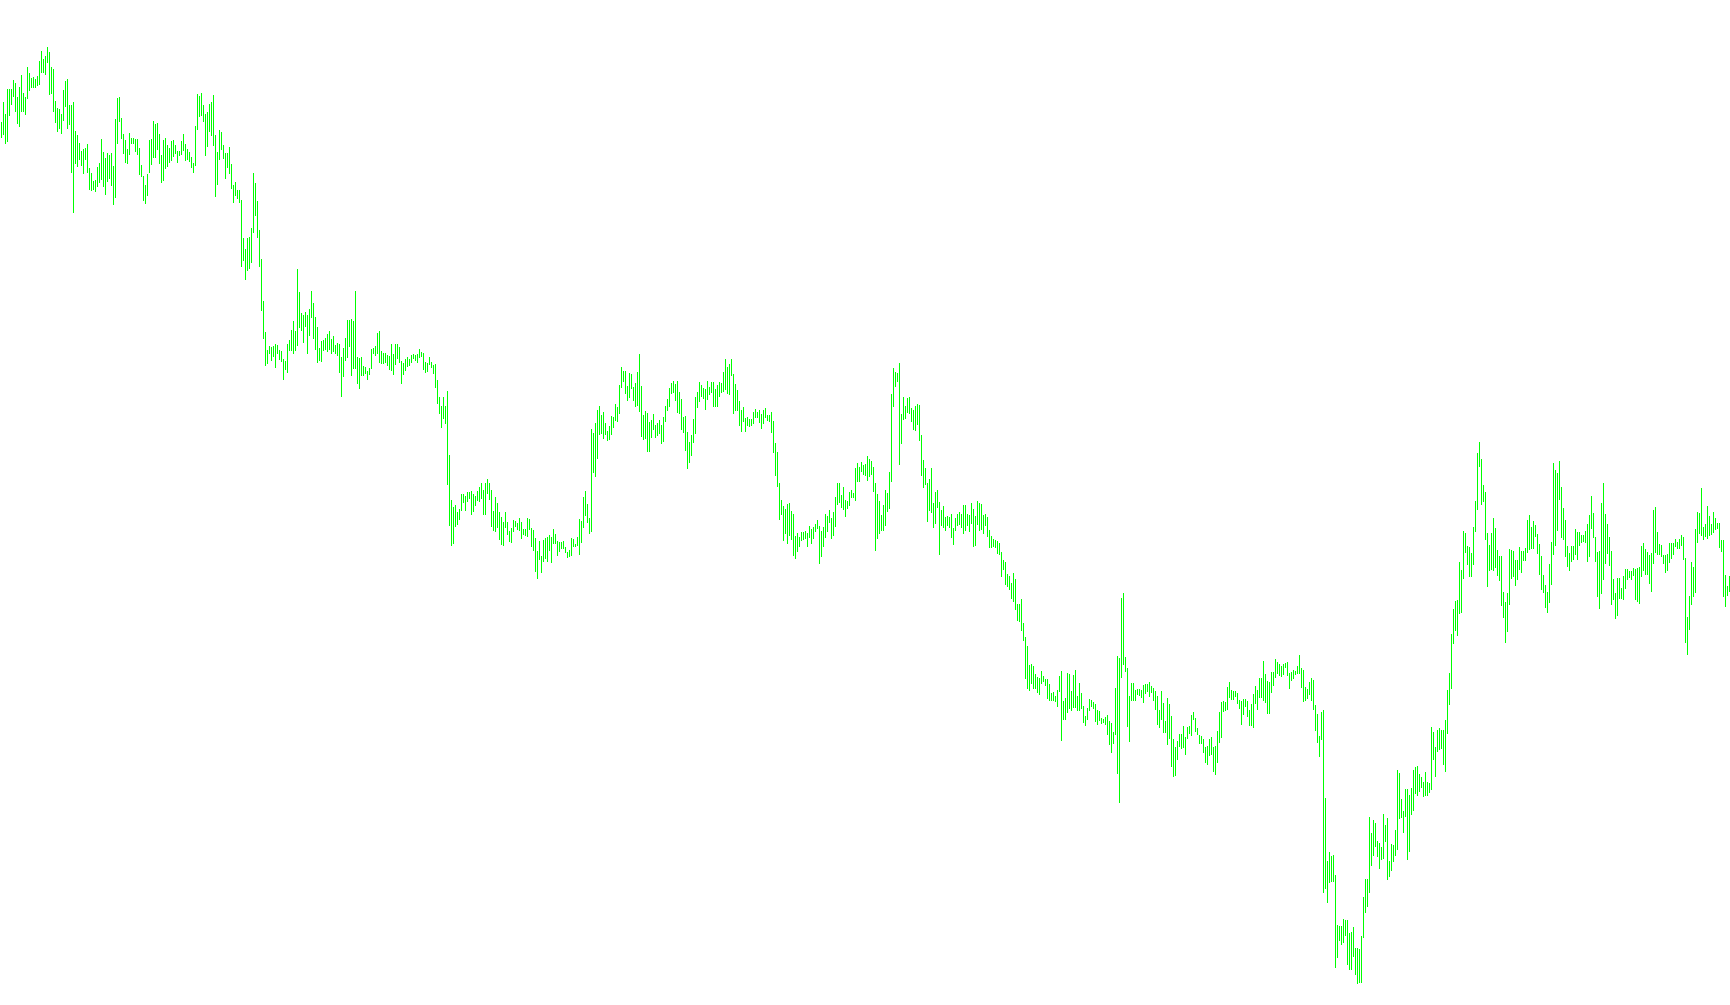
This script is a specialized technical analysis tool designed to help traders identify trend direction and manage risk by automatically calculating "Stop Loss" levels. It builds upon the logic of Bollinger Bands—a common market indicator used to measure volatility—but adds a proprietary filtering mechanism to create more stable, trailing support and resistance lines.
Core Logic and Behavior
1. Trend Identification The script continuously monitors price action relative to the upper and lower boundaries of the Bollinger Bands. It determines the current market "trend" based on whether the price has broken out beyond these boundaries.
- If the price closes above the upper band, the script identifies an upward trend.
- If the price closes below the lower band, it identifies a downward trend.
2. Dynamic Support and Resistance Tracking Once a trend is established, the script calculates specific "Stop" levels. Instead of just following the standard bands, it uses a mathematical formula (incorporating a user-defined risk factor) to create a more precise price level for support (in an uptrend) or resistance (in a downtrend).
A key feature here is the "ratchet" logic:
- In an uptrend, the script tracks the highest possible floor for your position. If the support level moves up, the script follows it; if it drops, the script holds the previous higher level.
- In a downtrend, it tracks the lowest possible ceiling. It follows the resistance down but will not allow the line to move back up, effectively locking in gains.
3. Visual Signals and Alerts The tool translates this complex math into three visual formats on your chart:
- Trend Lines: Continuous lines that show the current active support or resistance level as it evolves.
- Arrows/Signals: Specific markers that appear when a trend shift is detected, notifying you of a potential entry point or a change in market sentiment.
- Audio Alerts: The script includes a notification system that triggers an audible "Alert" the moment a new trend is identified, ensuring you don't have to watch the screen constantly.
4. Customization Options The script allows users to toggle various display modes, such as choosing whether to see only the lines, only the signals, or both. It also includes a "Money Risk" factor that allows the user to mathematically expand or contract the distance between the trend line and the price action, providing flexibility for different trading styles.
#property copyright "Copyright © 2008, MetaQuotes Software Corp."
#property link      "http://www.metaquotes.net"

#property indicator_chart_window
#property indicator_buffers 6
#property indicator_color1 Lime
#property indicator_color2 Gold
#property indicator_color3 Lime
#property indicator_color4 Gold
#property indicator_color5 Lime
#property indicator_color6 Gold
//---- input parameters
extern int    Length=8;      // Bollinger Bands Period
extern int    Deviation=1;    // Deviation was 2
extern double MoneyRisk=1.00; // Offset Factor
extern int    Signal=1;       // Display signals mode: 1-Signals & Stops; 0-only Stops; 2-only Signals;
extern int    Line=1;         // Display line mode: 0-no,1-yes
extern int    Nbars=1000;
//---- indicator buffers
double UpTrendBuffer[];
double DownTrendBuffer[];
double UpTrendSignal[];
double DownTrendSignal[];
double UpTrendLine[];
double DownTrendLine[];
extern bool SoundON=true;
bool TurnedUp = false;
bool TurnedDown = false;
//+------------------------------------------------------------------+
//| Custom indicator initialization function                         |
//+------------------------------------------------------------------+
  int init()
  {
   string short_name;
//---- indicator line

   SetIndexBuffer(0,UpTrendBuffer);
   SetIndexBuffer(1,DownTrendBuffer);
   SetIndexBuffer(2,UpTrendSignal);
   SetIndexBuffer(3,DownTrendSignal);
   SetIndexBuffer(4,UpTrendLine);
   SetIndexBuffer(5,DownTrendLine);
   SetIndexStyle(0,DRAW_ARROW,0,0);
   SetIndexStyle(1,DRAW_ARROW,0,0);
   SetIndexStyle(2,DRAW_ARROW,0,1);
   SetIndexStyle(3,DRAW_ARROW,0,1);
   SetIndexStyle(4,DRAW_LINE);
   SetIndexStyle(5,DRAW_LINE);
   SetIndexArrow(0,159);
   SetIndexArrow(1,159);
   SetIndexArrow(2,233);
   SetIndexArrow(3,234);
   IndicatorDigits(MarketInfo(Symbol(),MODE_DIGITS));
//---- name for DataWindow and indicator subwindow label
   short_name="BBands Stop("+Length+","+Deviation+")";
   IndicatorShortName(short_name);
   SetIndexLabel(0,"UpTrend Stop");
   SetIndexLabel(1,"DownTrend Stop");
   SetIndexLabel(2,"UpTrend Signal");
   SetIndexLabel(3,"DownTrend Signal");
   SetIndexLabel(4,"UpTrend Line");
   SetIndexLabel(5,"DownTrend Line");
//----
   SetIndexDrawBegin(0,Length);
   SetIndexDrawBegin(1,Length);
   SetIndexDrawBegin(2,Length);
   SetIndexDrawBegin(3,Length);
   SetIndexDrawBegin(4,Length);
   SetIndexDrawBegin(5,Length);
//----
   return(0);
  }

//+------------------------------------------------------------------+
//| Bollinger Bands_Stop_v1                                             |
//+------------------------------------------------------------------+
int start()
  {
   int    i,shift,trend;
   double smax[25000],smin[25000],bsmax[25000],bsmin[25000];

   for (shift=Nbars;shift>=0;shift--)
   {
   UpTrendBuffer[shift]=0;
   DownTrendBuffer[shift]=0;
   UpTrendSignal[shift]=0;
   DownTrendSignal[shift]=0;
   UpTrendLine[shift]=EMPTY_VALUE;
   DownTrendLine[shift]=EMPTY_VALUE;
   }

   for (shift=Nbars-Length-1;shift>=0;shift--)
   {
     smax[shift]=iBands(NULL,0,Length,Deviation,0,PRICE_CLOSE,MODE_UPPER,shift);
	  smin[shift]=iBands(NULL,0,Length,Deviation,0,PRICE_CLOSE,MODE_LOWER,shift);

	  if (Close[shift]>smax[shift+1]) trend=1;
	  if (Close[shift]<smin[shift+1]) trend=-1;

	  if(trend>0 && smin[shift]<smin[shift+1]) smin[shift]=smin[shift+1];
	  if(trend<0 && smax[shift]>smax[shift+1]) smax[shift]=smax[shift+1];

	  bsmax[shift]=smax[shift]+0.5*(MoneyRisk-1)*(smax[shift]-smin[shift]);
	  bsmin[shift]=smin[shift]-0.5*(MoneyRisk-1)*(smax[shift]-smin[shift]);

	  if(trend>0 && bsmin[shift]<bsmin[shift+1]) bsmin[shift]=bsmin[shift+1];
	  if(trend<0 && bsmax[shift]>bsmax[shift+1]) bsmax[shift]=bsmax[shift+1];

	  if (trend>0)
	  {
	     if (Signal>0 && UpTrendBuffer[shift+1]==-1.0)
	     {
	     UpTrendSignal[shift]=bsmin[shift];
	     UpTrendBuffer[shift]=bsmin[shift];
	     if(Line>0) UpTrendLine[shift]=bsmin[shift];
     if (SoundON==true && shift==0 && !TurnedUp)
         {
     Alert("BBands Stop Alert Buy --> ",Symbol(),"@TF",Period());
                       TurnedUp = true;
            TurnedDown = false;
     }
	     }
	     else
	     {
	     UpTrendBuffer[shift]=bsmin[shift];
	     if(Line>0) UpTrendLine[shift]=bsmin[shift];
	     UpTrendSignal[shift]=-1;
	     }
	  if (Signal==2) UpTrendBuffer[shift]=0;
	  DownTrendSignal[shift]=-1;
	  DownTrendBuffer[shift]=-1.0;
	  DownTrendLine[shift]=EMPTY_VALUE;
	  }
	  if (trend<0)
	  {
	  if (Signal>0 && DownTrendBuffer[shift+1]==-1.0)
	     {
	     DownTrendSignal[shift]=bsmax[shift];
	     DownTrendBuffer[shift]=bsmax[shift];
	     if(Line>0) DownTrendLine[shift]=bsmax[shift];
     if (SoundON==true && shift==0 && !TurnedDown)
         {
     Alert("Bbands Stop Alert Sell --> ",Symbol(),"@TF",Period());
            TurnedDown = true;
            TurnedUp = false;
     }
	     }
	     else
	     {
	     DownTrendBuffer[shift]=bsmax[shift];
	     if(Line>0)DownTrendLine[shift]=bsmax[shift];
	     DownTrendSignal[shift]=-1;
	     }
	  if (Signal==2) DownTrendBuffer[shift]=0;
	  UpTrendSignal[shift]=-1;
	  UpTrendBuffer[shift]=-1.0;
	  UpTrendLine[shift]=EMPTY_VALUE;
	  }

	 }
	return(0);
 }
Comments