BatFink (Target 1)
Download script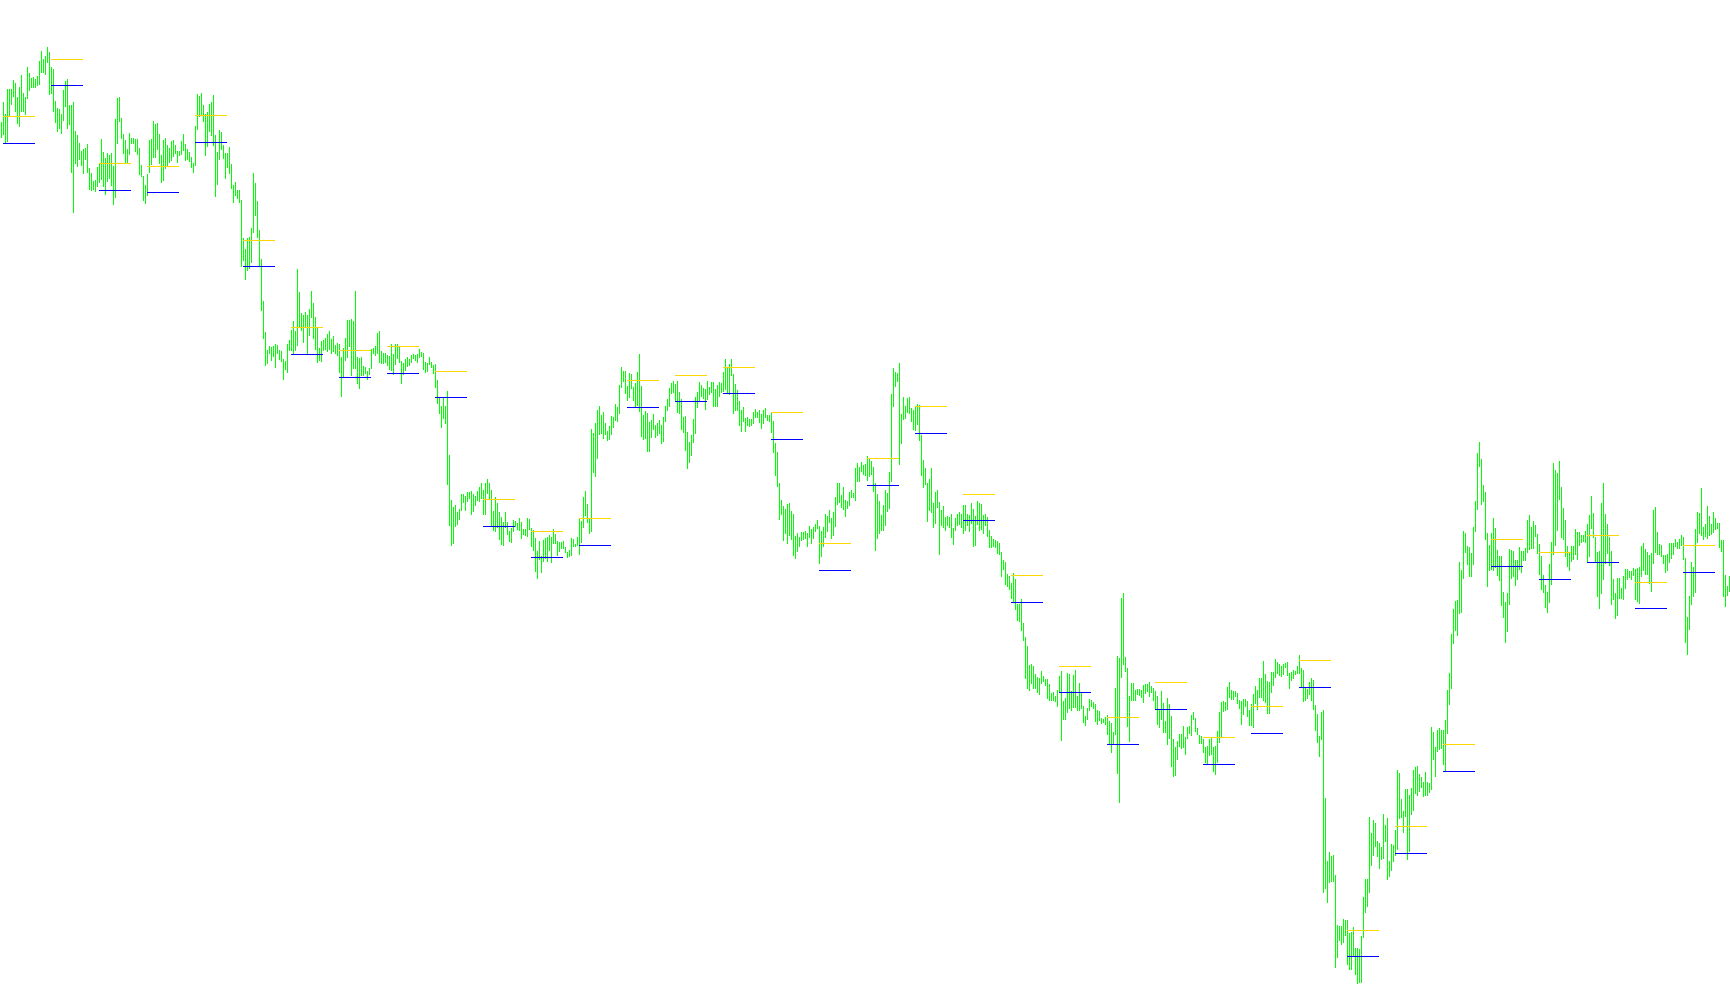
This tool is designed to help traders visualize specific price levels on their charts based on historical price action within defined timeframes. It essentially identifies key "zones" by looking at how the market behaved during specific hours of the day and then projects those levels forward to assist in identifying potential entry points.
Core Logic and Functionality
Time Zone Synchronization The script is built to be flexible regarding different geographic locations. It allows users to input their local time zone and a destination time zone. This ensures that the "day" and the specific trading hours are calculated correctly regardless of where your server is hosted or where you are physically located.
Segmented Time Analysis Instead of looking at the entire day as one block, the script breaks the trading day into three distinct chronological segments:
- The First Period: The earliest designated window of the day.
- The Second Period: A subsequent specific window.
- The Remainder of the Day: Everything else following the first two windows.
Identifying Highs and Lows The logic automatically scans these three periods to find specific price extremes (the highest and lowest points reached). It monitors each bar of data to determine where the market "started" and "ended" for each segment. Once a period is completed, it locks in those results to use as reference points.
Zone Projection This is the primary visual output of the script. Once the first time period is finished, the tool takes the price data from that specific window and projects two horizontal lines onto your chart:
- Upper Zone: Calculated by taking a reference price and adding a user-defined amount of pips (the "PipsForEntry" setting).
- Lower Zone: Calculated by taking that same reference price and subtracting the same amount of pips.
Dynamic Reset The script is designed to be "intelligent" regarding the calendar. It automatically detects when a new day begins on the chart. When it detects a new day, it clears all previous calculations and resets the tracking variables, ensuring that the lines and zones are always relevant to the current trading day rather than being cluttered by old data.
Summary for the User
In simple terms, this script looks at how the market moved during the first few hours of the day, calculates a specific "buffer" or "zone" based on those movements, and draws lines on your chart to show you where those levels sit. It helps you visualize these price boundaries automatically so you can identify potential trading areas without having to manually calculate historical highs and lows for every new session.
//+------------------------------------------------------------------+
//|  Batfink Daily Range.MT4                                         |
//|                                                                  |
//+------------------------------------------------------------------+


/* Introduction:

   Draw Line at 00:00GMT + and - 55

   TimeZONE Information - Indicator can be used for different Time Zones.
                          For Batfink settings set to -5 for MetaQuotes demo Server
                          This will place home line at 00:00GMT Time

*/

#property indicator_chart_window
#property indicator_buffers 5
#property indicator_color1 Yellow
#property indicator_color2 LightSteelBlue

extern int LocalTimeZone= 2;
extern int DestTimeZone= 0;
extern int PipsForEntry= 55;

double Zone1Upper[];
double Zone1Lower[];

//+------------------------------------------------------------------+
//| Custom indicator initialization function                         |
//+------------------------------------------------------------------+

int init()
{
   SetIndexStyle(0,DRAW_LINE);
   SetIndexBuffer(0,Zone1Upper);
   SetIndexEmptyValue(0, 0.0);

   SetIndexStyle(1,DRAW_LINE);
   SetIndexBuffer(1,Zone1Lower);
   SetIndexEmptyValue(1, 0.0);

   return(0);
}

int deinit()
{

   return(0);
}

//+------------------------------------------------------------------+
//| Custom indicator iteration function                              |
//+------------------------------------------------------------------+

int start()
{
   int counted_bars= IndicatorCounted(),
         lastbar, result;

   if (Bars<=100)
      return(0);

   if (counted_bars>0)
      counted_bars--;

   lastbar= Bars - counted_bars;

   BreakoutRanges(0, lastbar, LocalTimeZone, DestTimeZone);

   return(0);
}

//+------------------------------------------------------------------+
//| Compute index of first/last bar of yesterday and today           |
//+------------------------------------------------------------------+

int BreakoutRanges(int offset, int lastbar, int tzlocal, int tzdest)
{
   int i, j, k,
       tzdiff= tzlocal - tzdest,
       tzdiffsec= tzdiff*3600,
       tidxstart[2]= { 0, 0},
       tidxend[2]= { 0, 0 };
   double topen[2]= { 0.0, 0.0 },
           tclose[2]= { 99999.9, 99999.9 };
   string tfrom[3]= { "07:00", "08:00" ,  /*rest of day: */ "12:00"},
          tto[3]=   { "08:00", "12:00",   /*rest of day: */ "24:00" },
          tday;
   bool inperiod= -1;
   datetime timet;

   //
   // search back for the beginning of the day
   //
   tday= TimeToStr(Time[lastbar]-tzdiffsec, TIME_DATE);
   for (  ; lastbar<Bars; lastbar++) {
      if (TimeToStr(Time[lastbar] - tzdiffsec, TIME_DATE)!=tday) {
         lastbar--;
         break;
      }
   }

   //
   // find the high/low for the two periods and carry them forward through the day
   //
   tday= "XXX";
   for (i= lastbar; i>=offset; i--) {

      timet= Time[i] - tzdiffsec;   // time of this bar

      string timestr= TimeToStr(timet, TIME_MINUTES),    // current time HH:MM
             thisday= TimeToStr(timet, TIME_DATE);       // current date


      //
      // for all three periods (first period, second period, rest of day)
      //

      for (j= 0; j<3; j++) {

         if (tfrom[j]<=timestr && timestr<tto[j]) {   // Bar[i] in this period

            if (inperiod!=j) { // entered new period, so last one is completed

               if (j>0) {      // now draw high/low back over the recently completed period

                  for (k= tidxstart[j-1]; k>=tidxend[j-1]; k--) {
                     if (j-1==0) {
                        Zone1Upper[k]= tclose[j-1];
                        Zone1Lower[k]= tclose[j-1];

                  }
               }

               inperiod= j;   // remember current period
            }

            // for the current period find idxstart, idxend and compute high/low
            if (tidxstart[j]==0) {
               tidxstart[j]= i;
               tday= thisday;
            }

            tidxend[j]= i;

            topen[j]= MathMax(topen[j], Open[i]);
            tclose[j]= MathMin(tclose[j], Close[i]);
         }
      }


      //------------------------------------------------------------------------
      // carry forward the periods for which we have definite high/lows
      //
      if (inperiod>=1 && tday==thisday) { // first time period completed
         Zone1Upper[i]= tclose[0] + PipsForEntry*Point;
         Zone1Lower[i]= tclose[0] - PipsForEntry*Point;

         }
      }

      //
      // at the beginning of a new day reset everything
      //
      if (tday!="XXX" && tday!=thisday) {
         Print("#", i, "new day ", thisday, "/", tday);

         tday= "XXX";

         inperiod= -1;

         for (j= 0; j<2; j++) {
            tidxstart[j]= 0;
            tidxend[j]= 0;

            topen[j]= 0;
            tclose[j]= 99999;
         }
      }
   }

   return (0);
}
Comments