Batfink Signal (Target 4)
Download script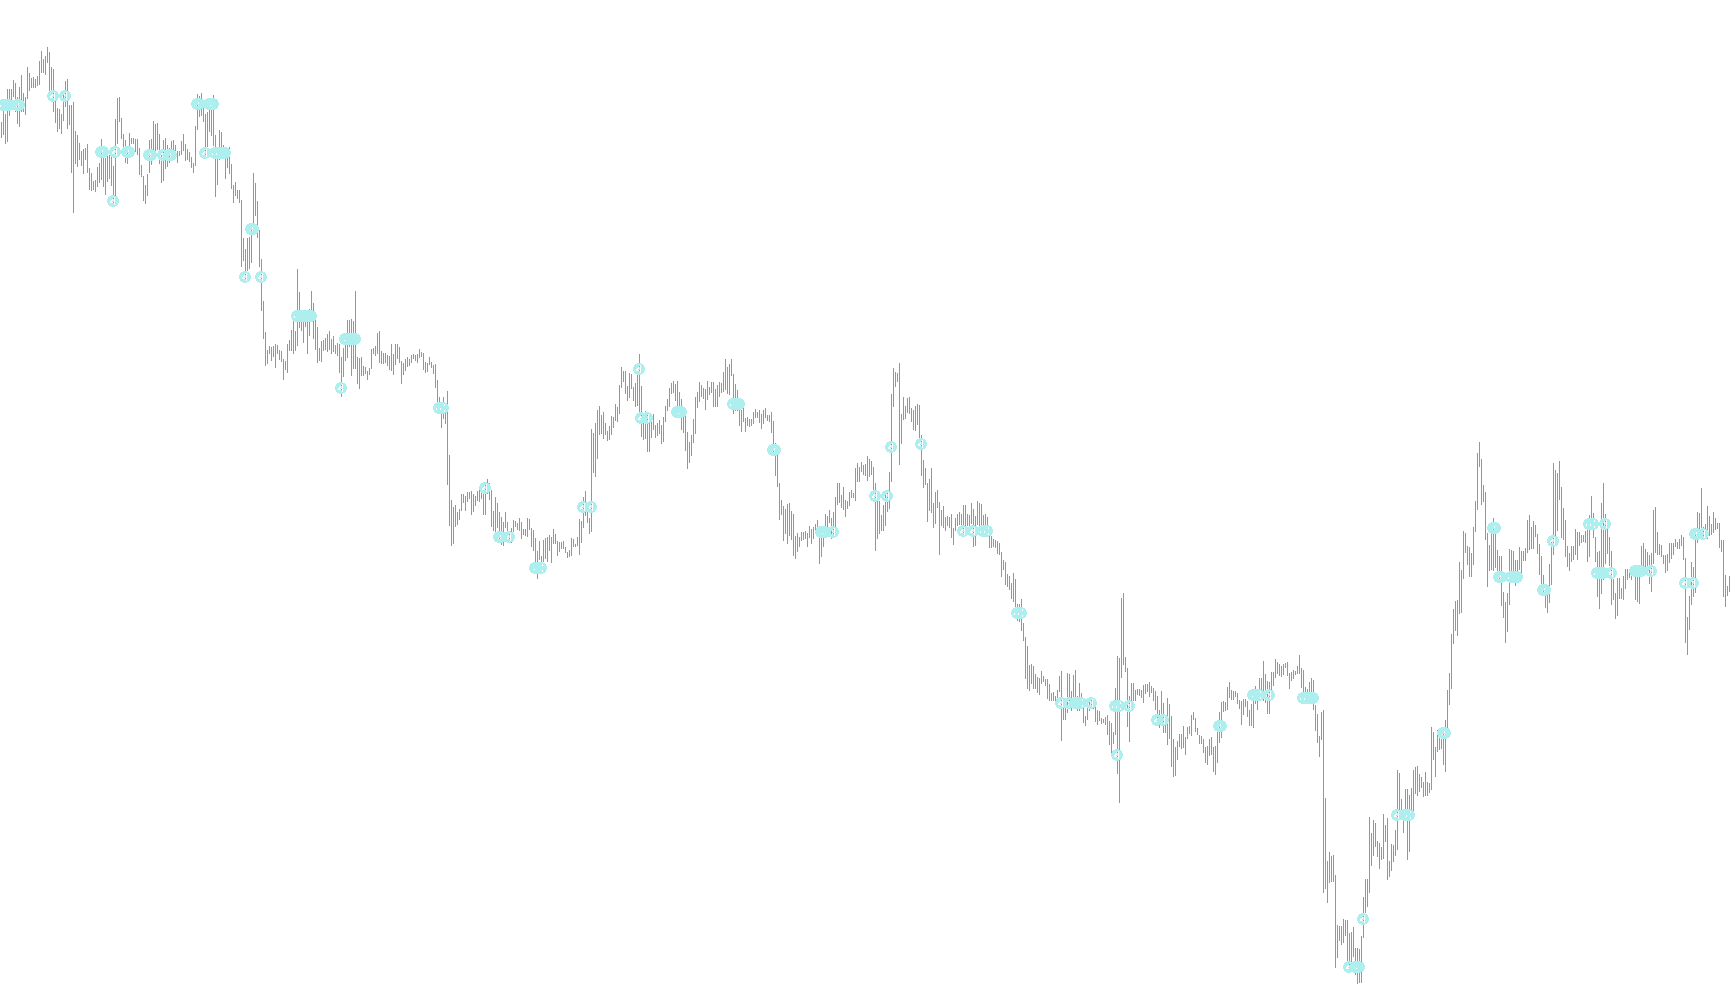
This tool is designed to help traders visualize and identify specific price breakouts based on the market's activity during the early hours of the trading day. It works by analyzing historical price movement across distinct time windows to establish "zones" for potential trade entries.
Core Logic Overview
The script divides each trading day into specific chronological blocks. Its primary goal is to monitor these periods, identify price extremes, and project those levels forward to help you spot when the market "breaks out" of its established range.
1. Time Zone Management
Because markets operate across different global regions, the tool includes a settings feature that allows you to align the data with your specific local time or the broker's server time. This ensures that the "start of the day" is calculated accurately regardless of where you are located.
2. Range Identification
The script segments the trading day into three distinct phases:
- Period 1: The initial opening movement (early morning).
- Period 2: The subsequent transition period.
- Rest of Day: The remaining active trading hours.
By tracking these periods, the tool identifies the price action occurring in the first segment. Once that period concludes, it uses those results to calculate a "Zone."
3. Dynamic Zone Projection
Instead of just looking at where the price was, the tool projects a target zone into the future. It takes the data from the completed periods and adds a customizable buffer (measured in Pips). This creates an upper and lower boundary line on your chart. These lines represent the "thresholds" that the market must cross to signify a significant shift in momentum.
4. Breakout Detection
The tool constantly monitors the live price against these projected boundaries. It looks for two specific types of signals:
- Buy Signals: Triggered when the price moves upward and breaks above the upper boundary.
- Sell Signals: Triggered when the price moves downward and breaks below the lower boundary.
To ensure high-quality signals, the logic specifically checks if the candles are actually crossing through the line (meaning the price started on one side and finished on the other), rather than just touching it briefly.
5. Automated Alerts
For active traders, the script includes an optional notification system. When the price breaks through one of the projected zones, the tool can trigger an instant visual alert on your screen. It is designed to be "smart" by ensuring it only notifies you once per breakout, preventing repetitive alerts on the same signal.
Summary for the User
In simple terms, this script watches how the market behaves at the start of the day and draws "boundaries" based on that behavior. When the price finally breaks out of those boundaries, the tool highlights the breakout with a visual marker (an arrow) and can notify you immediately, helping you identify potential new trends in real-time.
//+------------------------------------------------------------------+
//|  Batfink Daily Range.MT4                                         |
//|                                                                  |
//+------------------------------------------------------------------+


/* Introduction:

   Draw Line at 00:00GMT + and - 100

   TimeZONE Information - Indicator can be used for different Time Zones.
                          For Batfink settings set to -5 for MetaQuotes demo Server
                          This will place home line at 00:00GMT Time

*/

#property indicator_chart_window
#property indicator_buffers 3
#property indicator_color1 White
#property indicator_color2 White
#property indicator_color3 Orange

extern bool DoEntryAlerts= false;
extern int LocalTimeZone= 2;
extern int DestTimeZone= 0;
extern int PipsForEntry= 100;

double Zone1Upper[];
double Zone1Lower[];
double EntrySignalsBuffer[];

//+------------------------------------------------------------------+
//| Custom indicator initialization function                         |
//+------------------------------------------------------------------+
int init()
{
   SetIndexStyle(0,DRAW_LINE);
   SetIndexBuffer(0,Zone1Upper);
   SetIndexEmptyValue(0, 0.0);

   SetIndexStyle(1,DRAW_LINE);
   SetIndexBuffer(1,Zone1Lower);
   SetIndexEmptyValue(1, 0.0);

   SetIndexStyle(2,DRAW_ARROW);
   SetIndexArrow(2, 143);
   SetIndexBuffer(2, EntrySignalsBuffer);
   SetIndexEmptyValue(2, 0.0);
   SetIndexLabel(2, "Zone Breakout Signal");

   return(0);
}

int deinit()
{

   return(0);
}

//+------------------------------------------------------------------+
//| Custom indicator iteration function                              |
//+------------------------------------------------------------------+
int start()
{
   int counted_bars= IndicatorCounted(),
         lastbar, result;

   if (Bars<=100)
      return(0);

   if (counted_bars>0)
      counted_bars--;

   lastbar= Bars - counted_bars;

   BreakoutRanges(0, lastbar, LocalTimeZone, DestTimeZone);

   //
   // check alerts
   //

   static datetime lastalerttime;
   static double lastalertprice;

   if (DoEntryAlerts && lastalerttime!=Time[0] && EntrySignalsBuffer[0]!=0 && EntrySignalsBuffer[0]!=lastalertprice) {
      Alert("ZoneBreakout signals entry!");
      lastalerttime= Time[0];
      lastalertprice= EntrySignalsBuffer[0];
   }
   else {
      lastalerttime= 0;
      lastalertprice= 0.0;
   }


   return(0);
}


//+------------------------------------------------------------------+
//| Compute index of first/last bar of yesterday and today           |
//+------------------------------------------------------------------+
int BreakoutRanges(int offset, int lastbar, int tzlocal, int tzdest)
{
   int i, j, k,
       tzdiff= tzlocal - tzdest,
       tzdiffsec= tzdiff*3600,
       tidxstart[2]= { 0, 0},
       tidxend[2]= { 0, 0 };
   double topen[2]= { 0.0, 0.0 },
           tclose[2]= { 99999.9, 99999.9 };
   string tfrom[3]= { "07:00", "08:00" ,  /*rest of day: */ "12:00"},
          tto[3]=   { "08:00", "12:00",   /*rest of day: */ "24:00" },
          tday;
   bool inperiod= -1;
   datetime timet;


   //
   // search back for the beginning of the day
   //
   tday= TimeToStr(Time[lastbar]-tzdiffsec, TIME_DATE);
   for (  ; lastbar<Bars; lastbar++) {
      if (TimeToStr(Time[lastbar] - tzdiffsec, TIME_DATE)!=tday) {
         lastbar--;
         break;
      }
   }


   //
   // find the high/low for the two periods and carry them forward through the day
   //
   tday= "XXX";
   for (i= lastbar; i>=offset; i--) {

      timet= Time[i] - tzdiffsec;   // time of this bar

      string timestr= TimeToStr(timet, TIME_MINUTES),    // current time HH:MM
             thisday= TimeToStr(timet, TIME_DATE);       // current date

      EntrySignalsBuffer[i]= 0;

      //
      // for all three periods (first period, second period, rest of day)
      //
      for (j= 0; j<3; j++) {

         if (tfrom[j]<=timestr && timestr<tto[j]) {   // Bar[i] in this period

            if (inperiod!=j) { // entered new period, so last one is completed

               if (j>0) {      // now draw high/low back over the recently completed period

                  for (k= tidxstart[j-1]; k>=tidxend[j-1]; k--) {
                     if (j-1==0) {
                        Zone1Upper[k]= tclose[j-1];
                        Zone1Lower[k]= tclose[j-1];

                  }
               }

               inperiod= j;   // remember current period
            }


            // for the current period find idxstart, idxend and compute high/low
            if (tidxstart[j]==0) {
               tidxstart[j]= i;
               tday= thisday;
            }

            tidxend[j]= i;

            topen[j]= MathMax(topen[j], Open[i]);
            tclose[j]= MathMin(tclose[j], Close[i]);
         }
      }


      //------------------------------------------------------------------------
      // carry forward the periods for which we have definite high/lows
      //
      if (inperiod>=1 && tday==thisday) { // first time period completed
         Zone1Upper[i]= tclose[0] + PipsForEntry*Point;
         Zone1Lower[i]= tclose[0] - PipsForEntry*Point;
    }

         CheckSignal(i, Zone1Upper[i], OP_BUY, EntrySignalsBuffer);
         CheckSignal(i, Zone1Lower[i], OP_SELL, EntrySignalsBuffer);
      }
    {   // none yet to carry forward (zero to clear old values, e.g. from switching timeframe)
         Zone1Upper[i]= 0;
         Zone1Lower[i]= 0;
      }


      //
      // at the beginning of a new day reset everything
      //
      if (tday!="XXX" && tday!=thisday) {
         Print("#", i, "new day ", thisday, "/", tday);

         tday= "XXX";

         inperiod= -1;

         for (j= 0; j<2; j++) {
            tidxstart[j]= 0;
            tidxend[j]= 0;

            topen[j]= 0;
            tclose[j]= 99999;
         }
      }
   }

   return (0);
}
//+------------------------------------------------------------------+
//| Check price break                                                |
//+------------------------------------------------------------------+
bool CheckSignal(int shift, double price, int type, double &signalbuffer[])
{
   bool signal= false;

   if (type==OP_BUY && ((Open[shift]<price && High[shift]>price) || (Close[shift+1]<price && Open[shift]>price)) ) {
      signalbuffer[shift]= price;
      signal= true;
  }

   if (type==OP_SELL && (Open[shift]>price && Low[shift]<price) || (Close[shift+1]>price && Open[shift]<price)) {
      signalbuffer[shift]= price;
      signal= true;
  }

  return (signal);
}
Comments