icrosshair
Download script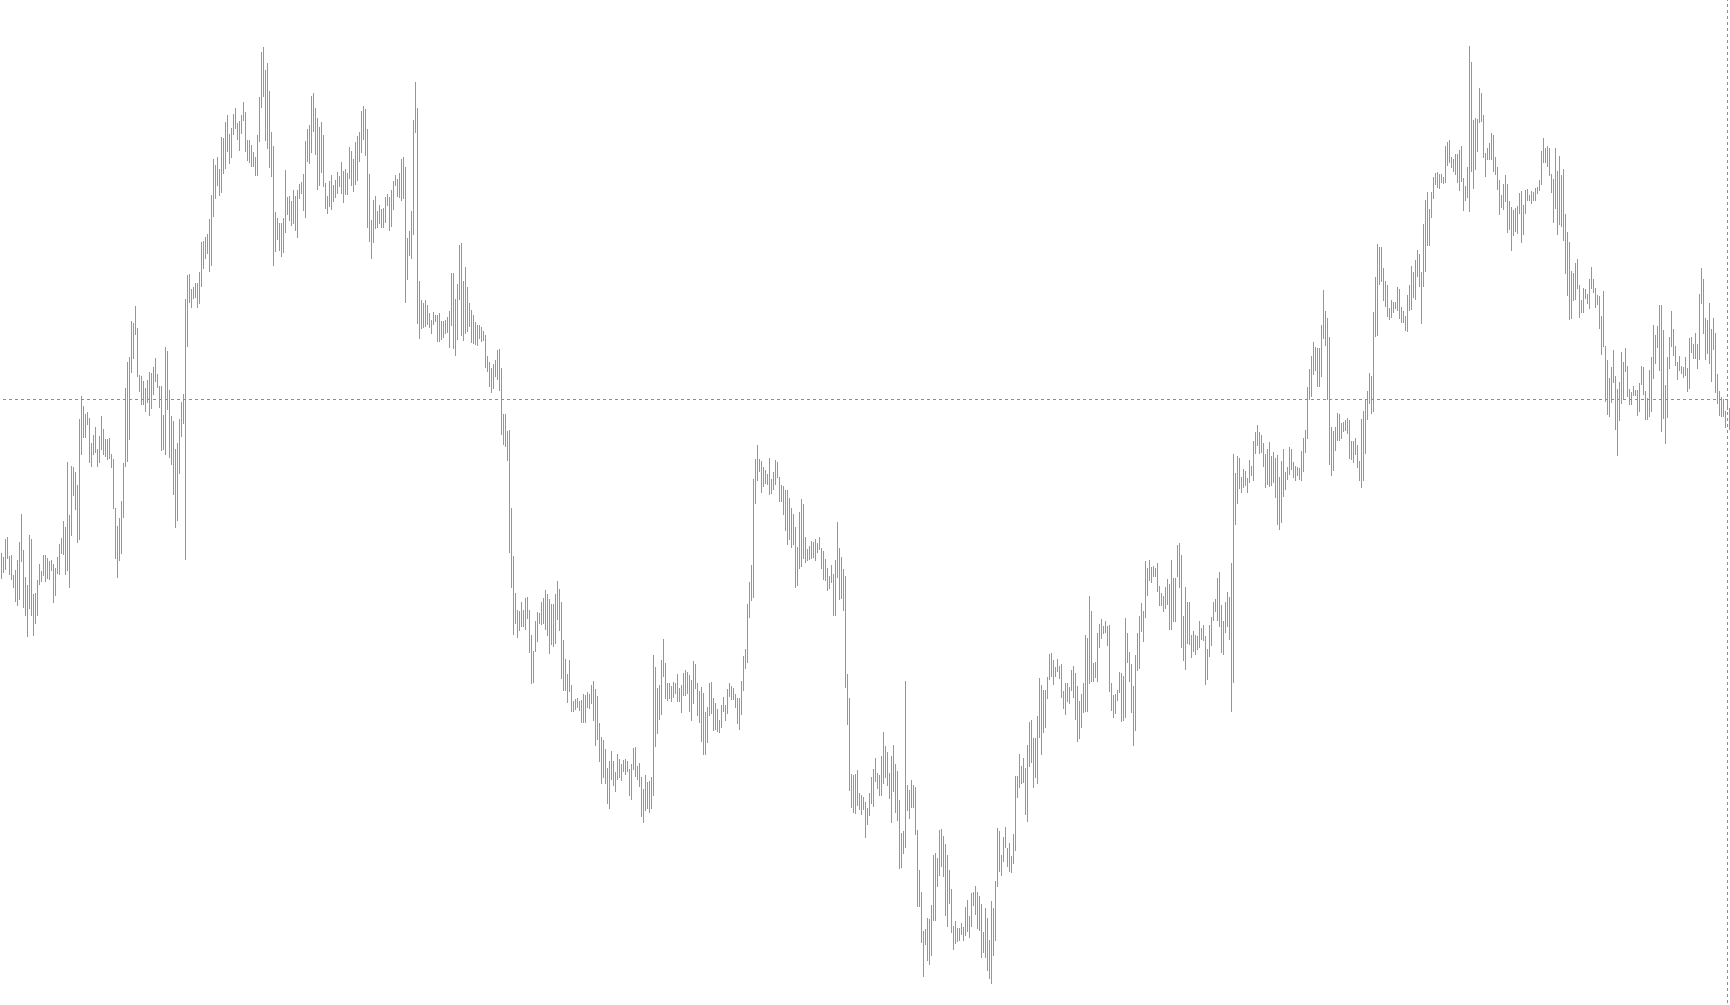
This tool is designed to enhance your trading chart by providing a dynamic, interactive visual aid that helps you analyze specific price points and candle data in real-time. Unlike static indicators, it responds directly to your mouse movements and interactions on the screen.
Key Functionalities
Interactive Crosshair & Real-Time Data The script places an invisible crosshair on your chart. As you move your cursor across the candles, the tool instantly identifies the exact price and time at that specific location. It provides a detailed "hover" summary (tooltip) that displays:
- The specific candle number.
- The Open, High, Low, and Close prices.
- The trading volume for that period.
- Advanced Candle Breakdown: It automatically calculates and displays the size of the upper wick, the main body of the candle, and the lower wick in pips.
Dynamic On-Screen Comments Depending on your settings, the tool can project text directly onto your chart window. This allows you to see the distance (in pips) between the current market price and the specific point your mouse is hovering over, making it easier to gauge market movement at a glance.
Click-to-Measure Logic The script includes an interactive measurement feature:
- Toggle Mode: You can click on the crosshair lines to activate or deactivate the mouse-tracking behavior.
- Distance Calculation: When you click on a specific point on the chart, the tool calculates the difference in pips between that clicked price and the horizontal level of the crosshair. This is particularly useful for measuring volatility or identifying how far the current price has moved from a previous key level.
Visual Customization To ensure the tool fits your trading style, it offers several adjustable visual parameters:
- Color & Style: Customize the line color and thickness.
- Visibility Toggles: You can choose whether to display the hover tooltips or the on-screen text comments to keep your workspace as clean as you prefer.
How It Works for the User
Essentially, this script transforms your chart into an interactive measuring tape. Instead of manually looking up values, you simply move your mouse to see a full breakdown of the price action and distance instantly, allowing for faster decision-making during live market sessions.
//+------------------------------------------------------------------+
//|                                                   iCrosshair.mq4 |
//|                                          Copyright 2015, Awran5. |
//|                                                 awran5@yahoo.com |
//+------------------------------------------------------------------+
#property copyright "Copyright 2015, Awran5."
#property link      "awran5@yahoo.com"
#property version   "1.01"
#property strict
#property indicator_chart_window

//-- 1.01 Added: option to remove tooltip

input bool            ShowTooltip = true; // Show Tooltip
input bool            ShowComment = true; // Show Comment
input color           Color  = clrTomato; // Line color
input ENUM_LINE_STYLE Style  = 2;         // Line style
input int             Width  = 1;         // Line width

double pips2double;
//+------------------------------------------------------------------+
//| Custom indicator initialization function                         |
//+------------------------------------------------------------------+
int OnInit()
  {
//---
// 4/5 digit brokers.
   if(Digits%2==1) pips2double=Point*10;
   else pips2double=Point;

   Draw("H Line",OBJ_HLINE,Time[0],High[0],Color,Style,Width,"Click me!");
   Draw("V Line",OBJ_VLINE,Time[0],High[0],Color,Style,Width,"Click me!");
//---
   return(INIT_SUCCEEDED);
  }
//+------------------------------------------------------------------+
//| deinitialization function                                        |
//+------------------------------------------------------------------+
void OnDeinit(const int reason)
  {
//---
   ObjectDelete("H Line");
   ObjectDelete("V Line");
//---
  }
//+------------------------------------------------------------------+
//| Custom indicator iteration function                              |
//+------------------------------------------------------------------+
int OnCalculate(const int rates_total,
                const int prev_calculated,
                const datetime &time[],
                const double &open[],
                const double &high[],
                const double &low[],
                const double &close[],
                const long &tick_volume[],
                const long &volume[],
                const int &spread[])
  {
//---

//--- return value of prev_calculated for next call
   return(rates_total);
  }
//+------------------------------------------------------------------+
//| ChartEvent function                                              |
//+------------------------------------------------------------------+
void OnChartEvent(const int id,
                  const long &lparam,
                  const double &dparam,
                  const string &sparam)
  {
//---
   if(!ShowComment) Comment("");
   static bool keyPressed=false;
   if(id==CHARTEVENT_OBJECT_CLICK)
     {
      if(sparam=="H Line" || sparam=="V Line")
        {
         if(!keyPressed) keyPressed=true;
         else keyPressed=false;
        }
      if(keyPressed) ChartSetInteger(0,CHART_EVENT_MOUSE_MOVE,true);
      else ChartSetInteger(0,CHART_EVENT_MOUSE_MOVE,false);
     }
//--- this is an event of a mouse move on the chart
   if(id==CHARTEVENT_MOUSE_MOVE)
     {
      //--- Prepare variables
      int      x     =(int)lparam;
      int      y     =(int)dparam;
      datetime time  =0;
      double   price =0;
      int      window=0;
      //--- Convert the X and Y coordinates in terms of date/time
      if(ChartXYToTimePrice(0,x,y,window,time,price))
        {
         int bar=iBarShift(NULL,0,time);
         string tooltip="";
         if(ShowTooltip)
           {
            tooltip="Candle: "+(string)bar+
                    "\nOpen: "+DoubleToStr(Open[bar],Digits)+
                    "\nHigh: "+DoubleToStr(High[bar],Digits)+
                    "\nClose: "+DoubleToStr(Close[bar],Digits)+
                    "\nLow: "+DoubleToStr(Low[bar],Digits)+
                    "\nVolume: "+DoubleToStr(Volume[bar],0)+
                    "\n----"+
                    "\nUp wick: "+DoubleToStr(upWick(bar),0)+
                    "\nBody: "+DoubleToStr(BarBody(bar),0)+
                    "\nDown wick: "+DoubleToStr(dnWick(bar),0);
           }
         //--- draw lines
         Draw("H Line",OBJ_HLINE,time,price,Color,Style,Width,tooltip);
         Draw("V Line",OBJ_VLINE,time,price,Color,Style,Width,tooltip);
         if(ShowComment)
           {
            double Pips=fabs(price-Close[0])/Point;
            Comment((string)bar+" / "+DoubleToStr(Pips,0)+" / "+DoubleToStr(price,Digits));
           }
        }
     }
   if(id==CHARTEVENT_CLICK && ShowComment)
     {
      //--- Prepare variables
      int      x     =(int)lparam;
      int      y     =(int)dparam;
      datetime time  =0;
      double   price =0;
      int      window=0;
      //--- Convert the X and Y coordinates in terms of date/time
      if(ChartXYToTimePrice(0,x,y,window,time,price))
        {
         datetime NewTime=(datetime)ObjectGet("V Line",OBJPROP_TIME1);
         double NewPrice=ObjectGet("H Line",OBJPROP_PRICE1);
         int NewBar=iBarShift(NULL,0,NewTime)-iBarShift(NULL,0,time);
         double NewPips=fabs(price-NewPrice)/Point;
         Comment((string)NewBar+" / "+DoubleToStr(NewPips,0)+" / "+DoubleToStr(price,Digits));
        }
     }
//---
  }
//+------------------------------------------------------------------+
//+------------------------------------------------------------------+
//|                                                                  |
//+------------------------------------------------------------------+
double upWick(int i)
  {
   double upBody=fmax(Open[i],Close[i]);
   return(fabs(High[i] - upBody)/pips2double);
  }
//+------------------------------------------------------------------+
//|                                                                  |
//+------------------------------------------------------------------+
double BarBody(int i)
  {
   double dnBody=fmin(Open[i],Close[i]),
   upBody=fmax(Open[i],Close[i]);
   return(fabs(upBody - dnBody)/pips2double);
  }
//+------------------------------------------------------------------+
//|                                                                  |
//+------------------------------------------------------------------+
double dnWick(int i)
  {
   double dnBody=fmin(Open[i],Close[i]);
   return(fabs(dnBody - Low[i])/pips2double);
  }
//+------------------------------------------------------------------+
//|                                                                  |
//+------------------------------------------------------------------+
void Draw(string name,int type,datetime time,double price,color clr,int style,int width,string tooltip)
  {
//---
   ObjectDelete(0,name);
   ObjectCreate(0,name,type,0,time,price);
   ObjectSet(name,OBJPROP_COLOR,clr);
   ObjectSet(name,OBJPROP_STYLE,style);
   ObjectSet(name,OBJPROP_WIDTH,width);
   ObjectSet(name,OBJPROP_BACK,false);
   ObjectSet(name,OBJPROP_ZORDER,0);
   ObjectSetString(0,name,OBJPROP_TOOLTIP,tooltip);
   ChartRedraw(0);
//---
  }
//+------------------------------------------------------------------+
Comments