heiken_ashi_arrows
Download script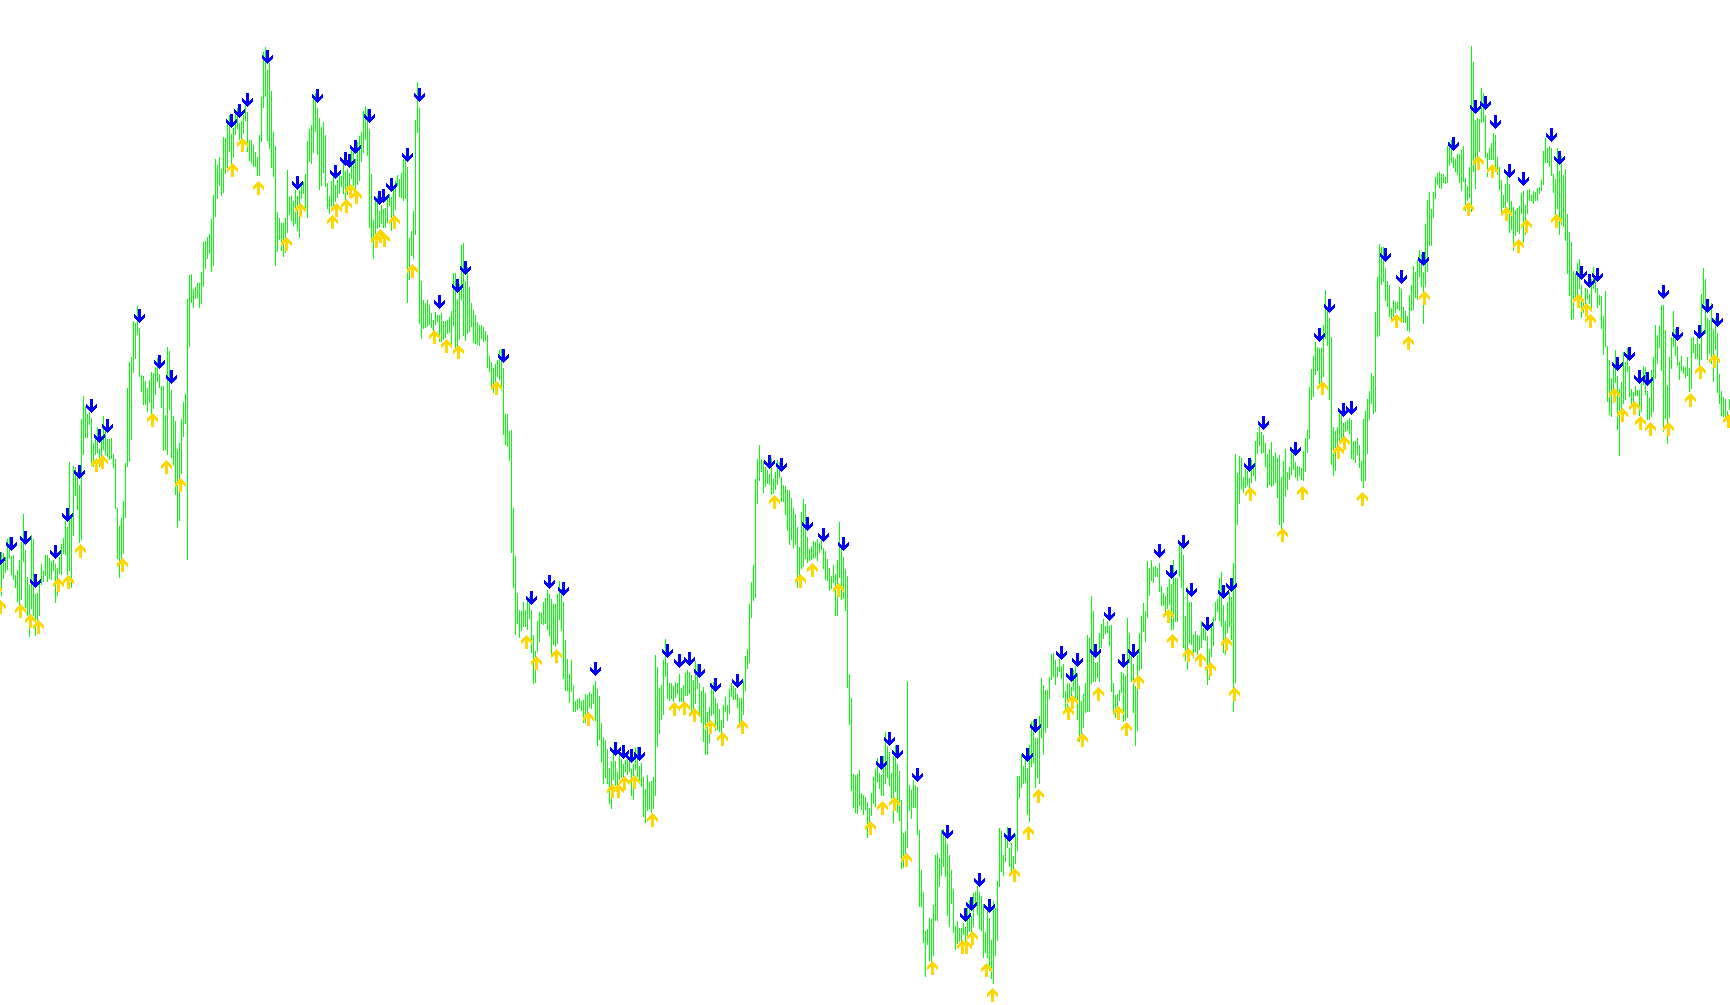
This tool is designed to simplify market analysis by identifying specific trend reversals on your trading chart using Heiken Ashi price action. Rather than requiring you to manually interpret complex candle patterns, the script automatically monitors the data and places visual markers (arrows) to highlight potential entry points.
How the Logic Works
1. Data Integration The script works by pulling information from a secondary "Heiken Ashi" calculation. Heiken Ashi is a type of candlestick chart that filters out market noise to show smoother price movements. The tool specifically looks at the relationship between the "body" and the "shadows" (the wicks) of these candles.
2. Identifying Buy Signals (Upward Momentum) The script looks for a specific pattern where two consecutive Heiken Ashi candles exhibit a downward-oriented structure relative to their previous state. When this specific mathematical condition is met, the tool identifies a potential shift in momentum and places a Green Arrow below the current price candle.
3. Identifying Sell Signals (Downward Momentum) Conversely, the script monitors for a pattern where two consecutive candles show a clear upward-oriented structure transitioning into a bearish phase. Once this logic is triggered, it places a Pink Arrow above the current price candle to signal a potential downward move.
4. Smart Filtering To prevent the tool from memberikan signals every single time the price moves slightly, the script uses a "toggle" system. It ensures that it doesn't fire multiple identical arrows in a row; it waits for a confirmed reversal of the current trend before signaling the next trade opportunity. This helps keep your chart clean and focuses on significant changes in direction.
5. Real-Time Notifications Beyond just visual cues on the chart, the logic includes an automated alert system. Depending on your preferences, the script can provide instant feedback through three different channels:
- Pop-up Alerts: A notification window that appears directly on your trading platform.
- Email Alerts: A message sent to your registered email address.
- Push Notifications: A mobile alert sent directly to your smartphone.
By automating this analysis, the tool allows you to stay informed of trend shifts in real-time without needing to constantly stare at every individual price tick.
//+------------------------------------------------------------------+
//|                                           Heiken Ashi Arrows.mq4 |
//|                      Copyright 2016, ACB Forex Trading Solutions |
//|                                  https://www.acbforextrading.com |
//+------------------------------------------------------------------+
#property copyright "Copyright 2016, ACB Forex Trading Solutions"
#property link      "https://www.acbforextrading.com"
#property version   "1.00"
#property strict
#property indicator_chart_window
#property indicator_buffers 2
#property indicator_color1 LawnGreen
#property indicator_color2 DeepPink
#property indicator_width1 1
#property indicator_width2 1
//+------------------------------------------------------------------+
//| Custom indicator initialization function                         |
//+------------------------------------------------------------------+
extern string Alerts  = "Configure Alerts";
extern bool PopUpAlert = true;    //Popup Alert
extern bool EmailAlert = true;   //Email Alert
extern bool PushAlert  = true;  //Push Notifications Alert
// UP and DOWN Buffers
double UP[];
double DOWN[];
// Distance of arrows from the high or low of a bar
int distance = 3;
///////////
int ct=0;
double MyPoint;
datetime CTime;

int OnInit()
  {
//--- indicator buffers mapping
  //UP Arrow Buffer
  SetIndexEmptyValue(0,0.0);
  SetIndexStyle(0,DRAW_ARROW,0,EMPTY);
  SetIndexArrow(0,233);
  SetIndexBuffer(0,UP);

  //DOWN Arrow Buffer
  SetIndexEmptyValue(1,0.0);
  SetIndexStyle(1,DRAW_ARROW,0,EMPTY);
  SetIndexArrow(1,234);
  SetIndexBuffer(1,DOWN);

  //Auto Adjustment for broker digits
  if (Digits()==5||Digits()==3){MyPoint=Point*10;} else{MyPoint=Point;}
  CTime=Time[0];
 //---
   return(INIT_SUCCEEDED);
  }
//+------------------------------------------------------------------+
//| Custom indicator iteration function                              |
//+------------------------------------------------------------------+
int OnCalculate(const int rates_total,
                const int prev_calculated,
                const datetime &time[],
                const double &open[],
                const double &high[],
                const double &low[],
                const double &close[],
                const long &tick_volume[],
                const long &volume[],
                const int &spread[])
  {
//---
 int limit = rates_total;
 int count=prev_calculated;
 //Main function
 for(int i=limit-count; i>=1;i--)
 {
 //Getting Heiken Ashi buffer values using the iCustom function
  double SH1 = iCustom(NULL,0,"Heiken Ashi",0,i);
  double BH1 = iCustom(NULL,0,"Heiken Ashi",1,i);
  double SH2 = iCustom(NULL,0,"Heiken Ashi",2,i);
  double BH2 = iCustom(NULL,0,"Heiken Ashi",3,i);

  if(SH1<BH1 && SH2<BH2 && ct==0)
  {
   UP[i]=Low[i]-distance*MyPoint;ct=1;
   if(CTime!=Time[0])
    {
     if(PopUpAlert){Alert(Symbol()," ","Buy Arrow");}
     if(EmailAlert){SendMail(Symbol()+"Buy Arrow"+"","Buy Signal");}
     if(PushAlert){SendNotification(Symbol()+"Buy Arrow"+"");}
     CTime=Time[0];
    }
  }
  if(SH1>BH1 && SH2>BH2 && ct==1)
  {
   DOWN[i]=High[i]+distance*MyPoint;ct=0;
   if(CTime!=Time[0])
    {
     if(PopUpAlert){Alert(Symbol()," ","Sell Arrow");}
     if(EmailAlert){SendMail(Symbol()+"Sell Arrow"+"","Sell Signal");}
     if(PushAlert){SendNotification(Symbol()+"Sell Arrow"+"");}
     CTime=Time[0];
    }
  }
 }
//--- return value of prev_calculated for next call
   return(rates_total);
  }
//+------------------------------------------------------------------+
Comments