highertimeframe
Download script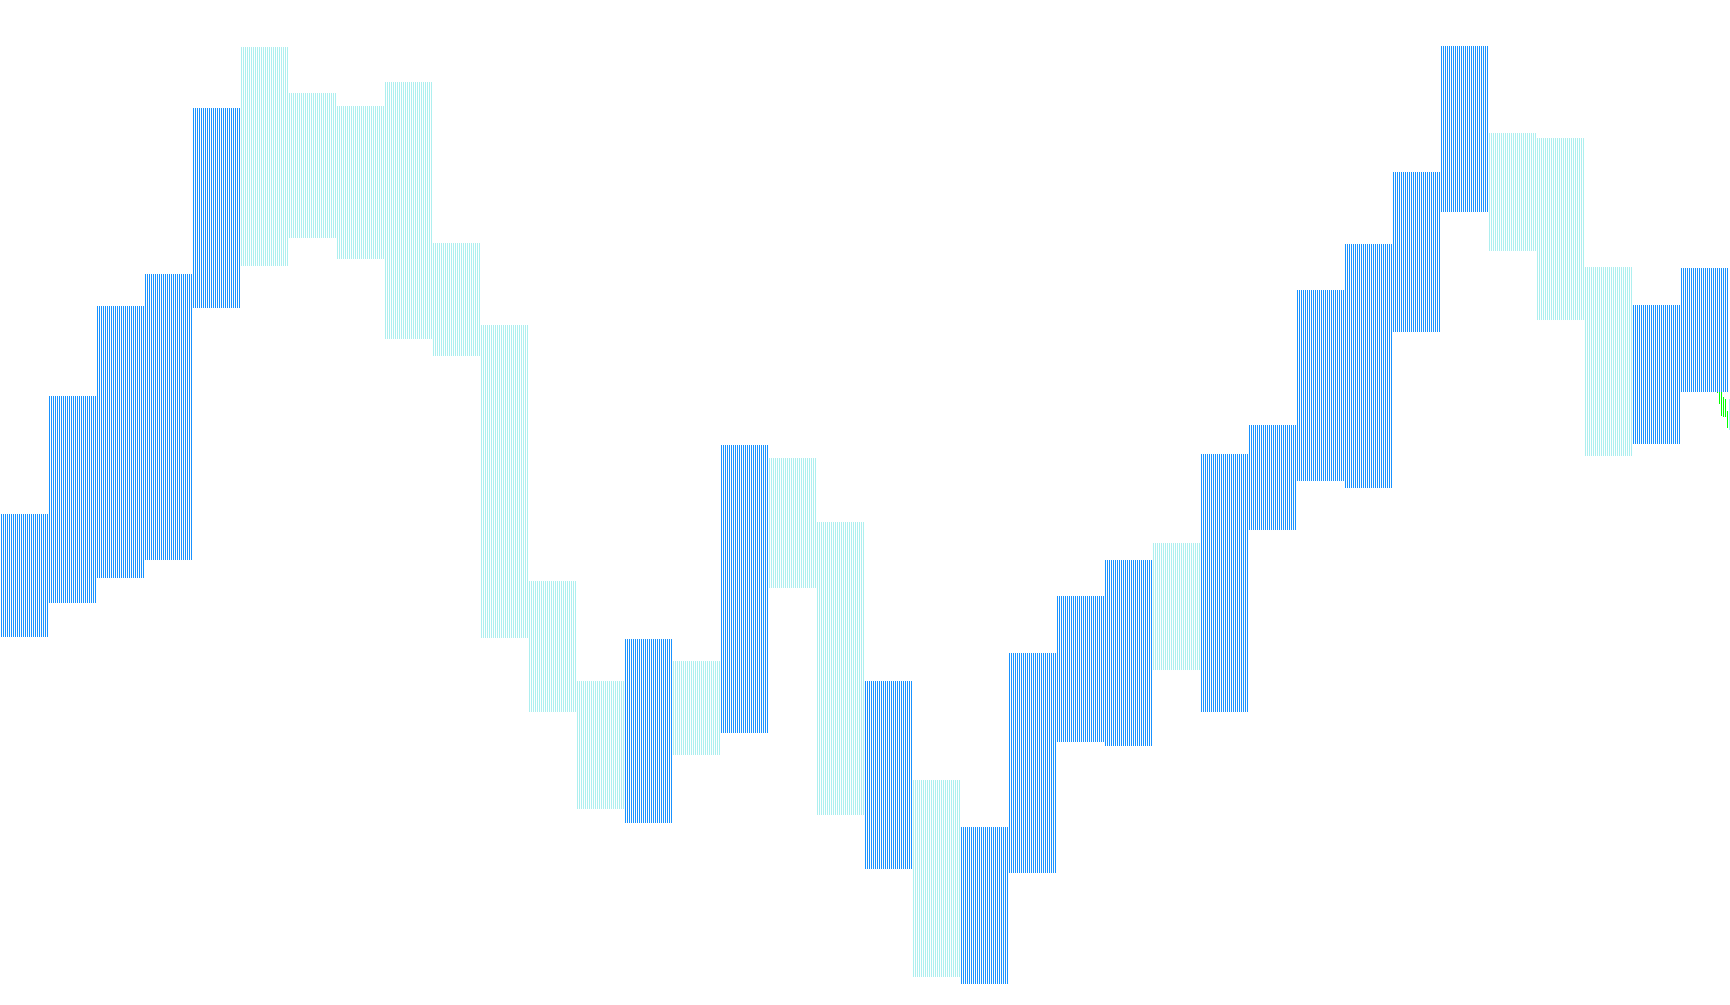
This script is designed to give traders a clearer perspective on the market by projecting price data from a larger timeframe onto a smaller one. Essentially, it helps you see the "big picture" without having to constantly switch back and forth between different time charts.
How the Logic Works
The primary purpose of this tool is to identify the specific price movements (Open, Close, High, and Low) of a higher timeframe—such as a Daily chart—and display them directly on your current smaller chart (like a 1-hour or 15-minute chart).
Here is the step-by-step logic of how the script processes this information:
1. Timeframe Synchronization The script looks at the "Higher Timeframe" you select in the settings. It scans through the history of your current chart and identifies where the periods of that larger timeframe begin and end.
2. Data Retrieval For every period of that larger timeframe, the script fetches four critical pieces of information:
- The opening price.
- The closing price.
- The highest price reached.
- The lowest price reached.
3. Dynamic High/Low Identification To ensure the data is visually useful, the script performs a small logic check on the movement of each higher timeframe candle:
- If the period closed higher than it opened (a bullish move), it assigns the highest point as one marker and the lowest point as the other.
- If the period closed lower or equal to its opening price (a bearish move), it swaps those roles to ensure the data remains consistent regardless of the direction of the trend.
4. Visual Representation Instead of just providing numbers, the script converts this data into a histogram on your screen. This allows you to see exactly where the "Highs" and "Lows" of the day (or whichever timeframe you choose) are sitting relative to the current price action in real-time.
Summary for the Trader
By using this script, you don't have to guess what the daily boundaries are while trading on a lower timeframe. The logic automatically maps out the "boundaries" of the larger timeframe, allowing you to see support and resistance levels more clearly while staying focused on your primary trading chart.
//+------------------------------------------------------------------+
//|                                                  HigherTimeframe |
//|                                       Copyright 2016, Il Anokhin |
//|                           http://www.mql5.com/en/users/ilanokhin |
//+------------------------------------------------------------------+
#property copyright "Copyright © 2016, Il Anokhin"
#property link "http://www.mql5.com/en/users/ilanokhin"
#property description ""
#property strict
//-------------------------------------------------------------------------
// Indicator settings
//-------------------------------------------------------------------------
#property  indicator_chart_window
#property  indicator_buffers 4
#property  indicator_color1 Red
#property  indicator_color2 LimeGreen
#property  indicator_color3 Red
#property  indicator_color4 LimeGreen
#property  indicator_width1 2
#property  indicator_width2 2
#property  indicator_style3 2
#property  indicator_style4 2
//-------------------------------------------------------------------------
// Inputs
//-------------------------------------------------------------------------
input ENUM_TIMEFRAMES TF=PERIOD_D1;     //Higher Timeframe
//-------------------------------------------------------------------------
// Variables
//-------------------------------------------------------------------------
double o[],c[],lh[],hl[];

int k;
//-------------------------------------------------------------------------
// 1. Initialization
//-------------------------------------------------------------------------
int OnInit(void)
  {

   IndicatorBuffers(4);

   SetIndexStyle(0,DRAW_HISTOGRAM);
   SetIndexStyle(1,DRAW_HISTOGRAM);
   SetIndexStyle(2,DRAW_HISTOGRAM);
   SetIndexStyle(3,DRAW_HISTOGRAM);

   SetIndexBuffer(0,o);
   SetIndexBuffer(1,c);
   SetIndexBuffer(2,lh);
   SetIndexBuffer(3,hl);

   Comment("Copyright © 2016, Il Anokhin");

   return(INIT_SUCCEEDED);

  }
//-------------------------------------------------------------------------
// 2. Deinitialization
//-------------------------------------------------------------------------
int deinit() {return(0);}
//-------------------------------------------------------------------------
// 3. Main function
//-------------------------------------------------------------------------
int OnCalculate(const int rates_total,
                const int prev_calculated,
                const datetime &time[],
                const double &open[],
                const double &high[],
                const double &low[],
                const double &close[],
                const long &tick_volume[],
                const long &volume[],
                const int &spread[])
  {

   int i,lim,cb;

   if(Bars<10) return(0);

   cb=IndicatorCounted();

   lim=Bars-cb;

   if(cb==0) lim=lim-11;

   if(cb>0) lim++;

//--- 3.1. Main loop ------------------------------------------------------

   k=0;

   for(i=0;i<lim;i++)
     {

      o[i]=iOpen(NULL,TF,k);

      c[i]=iClose(NULL,TF,k);

      if(c[i]>o[i]) {hl[i]=iHigh(NULL,TF,k); lh[i]=iLow(NULL,TF,k);}

      if(c[i]<=o[i]) {lh[i]=iHigh(NULL,TF,k); hl[i]=iLow(NULL,TF,k);}

      if(iTime(NULL,0,i)==iTime(NULL,TF,k)) k++;

     }

//--- 3.2. End of main function -------------------------------------------

   return(rates_total);

  }

//-------------------------------------------------------------------------
Comments