HeikenAshiOscillator
Download script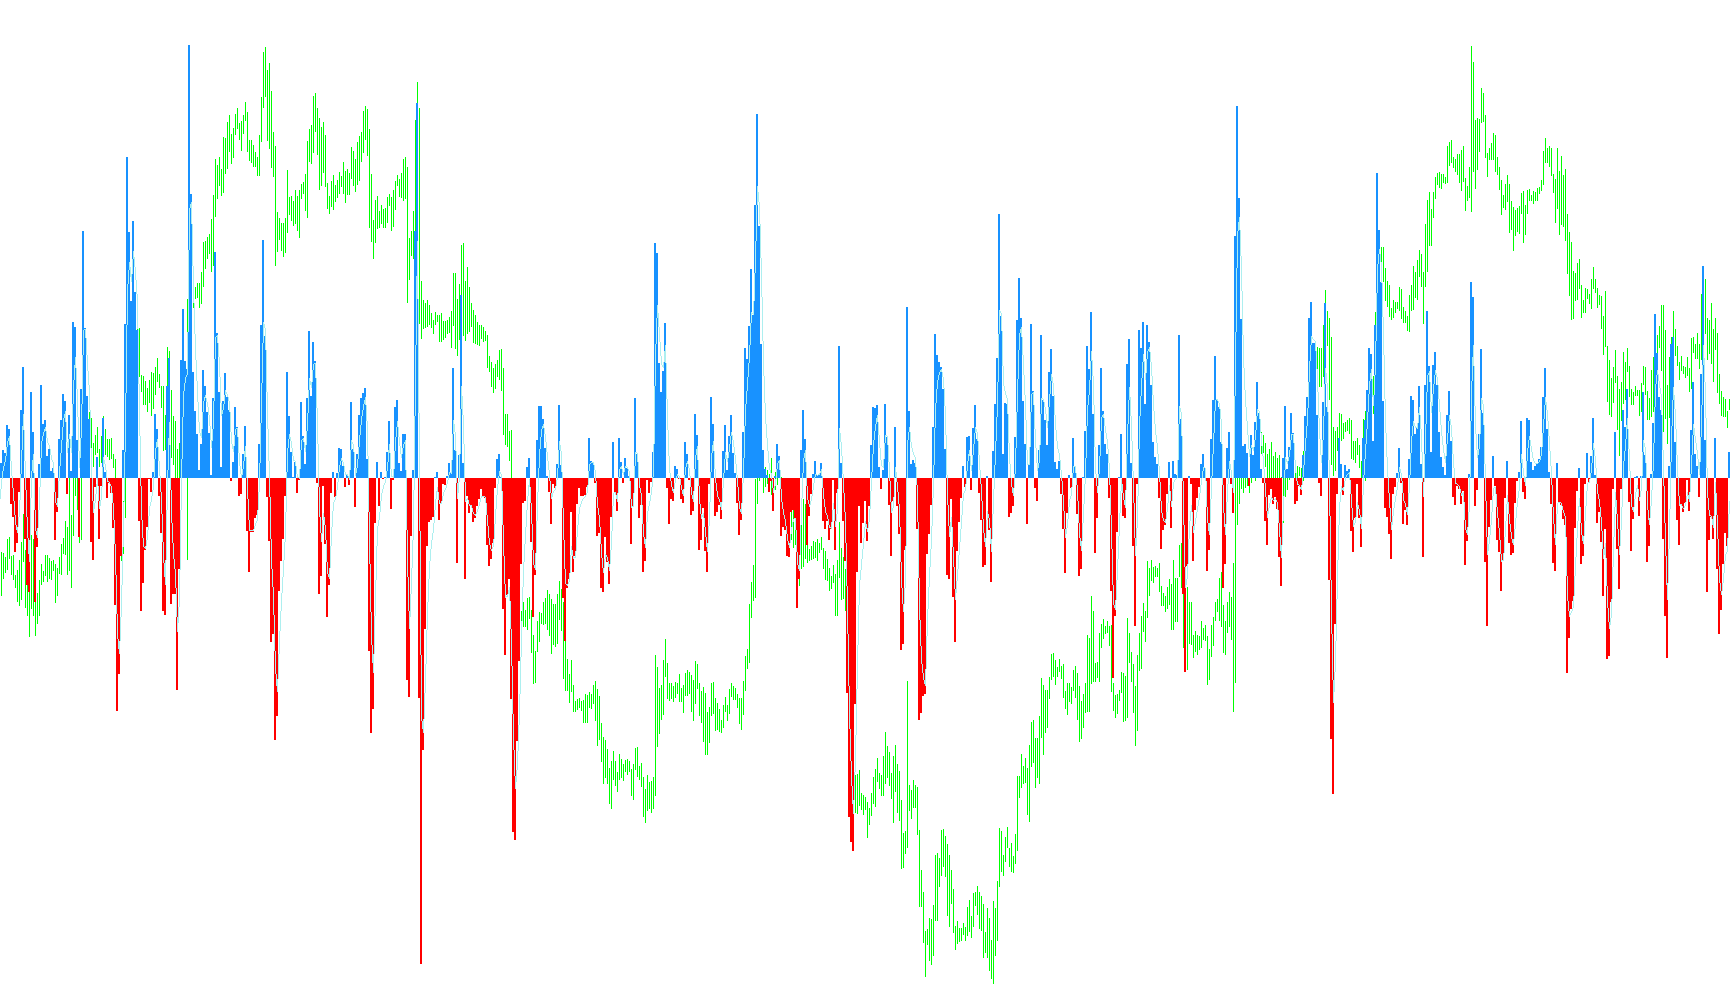
This indicator is designed to provide traders with a visual representation of market momentum by analyzing price action through the lens of Heiken Ashi dynamics. Instead of looking at raw price candles, it focuses on the underlying movement trends to help identify whether the market is currently leaning towards bullish or bearish sentiment.
How the Logic Works
The script functions by pulling data from a standard Heiken Ashi calculation and processing it through three distinct logical steps:
1. Data Extraction and Median Calculation The indicator first identifies the "Open" and "Close" values of Heiken Ashi candles for every point on the chart. It then calculates the Median Price by finding the midpoint between these two values. This helps smooth out minor price fluctuations and focuses on the core body of the price action.
2. Momentum Difference (The Oscillator) Once the Median Price is established, the script calculates the difference between the current median and the previous one. This "Difference" value tells us how much the price moved in a single step.
- If the price moved up compared to the previous step, the value is positive.
- If the price moved down, the value is negative.
3. Directional Filtering and Visualization The script then applies a rule to separate these movements into visual categories based on whether the Heiken Ashi candle itself is bullish (closing higher than it opened) or bearish (opening higher than it closed):
- Bullish Sentiment: When the candle shows upward strength, the indicator displays the momentum difference as a positive movement (shown in blue).
- Bearish Sentiment: When the candle shows downward strength, the indicator displays the momentum difference as a negative movement (shown in red).
- Neutrality: If the sentiment doesn't match the movement type, the indicator zeroes out that specific data point to keep the chart clean and readable.
4. Smoothing the Trend Finally, the script applies a Moving Average to these differences. This creates a third visual element (a teal line) that smooths out the "noise" of the oscillator. This line helps traders see the broader trend of the momentum, making it easier to distinguish between temporary price spikes and sustained shifts in market direction.
Summary for the User
In simple terms, this tool converts complex price movements into a clear, three-part visual summary. It tells you:
- The Strength: How fast the price is moving (the height of the histogram).
- The Direction: Whether that movement is currently favoring buyers or sellers (the color of the histogram).
- The Trend: The general flow of that momentum over a set period (the teal line).
//+------------------------------------------------------------------+
//| HeikenAshiOscillator.mq4
//| Copyright http://www.pointzero-indicator.com
//+------------------------------------------------------------------+

#property copyright "Copyright © Pointzero-indicator.com"
#property link      "http://www.pointzero-indicator.com"

#property indicator_separate_window
#property indicator_buffers 3
#property indicator_color1 DodgerBlue
#property indicator_color2 Red
#property indicator_color3 Teal
#property indicator_width1 2
#property indicator_width2 2
#property indicator_width3 1
#define MaMetod 2

//-------------------------------
// External variables
//-------------------------------
extern int AvPeriod = 2;

//-------------------------------
// Buffers
//-------------------------------

double FextMapBuffer1[];
double FextMapBuffer2[];
double FextMapBuffer3[];
double FextMapBuffer4[];
double FextMapBuffer5[];

//+------------------------------------------------------------------+
//| Custom indicator initialization function                         |
//|------------------------------------------------------------------|
int init()
{
   // Total buffers
   IndicatorBuffers(5);

   // Visible buffers
   SetIndexStyle(0,DRAW_HISTOGRAM, 0, indicator_width1, indicator_color1);
   SetIndexBuffer(0, FextMapBuffer1);
   SetIndexStyle(1,DRAW_HISTOGRAM, 0, indicator_width2, indicator_color2);
   SetIndexBuffer(1, FextMapBuffer2);
   SetIndexStyle(3,DRAW_LINE, 0, indicator_width3, indicator_color3);
   SetIndexBuffer(2,FextMapBuffer3);

   // Internal
   SetIndexBuffer(3,FextMapBuffer4);
   SetIndexBuffer(4,FextMapBuffer5);

   // My name
   IndicatorShortName("Heiken Ashi Oscillator");
   Comment("Copyright © http://www.pointzero-indicator.com");
   return(0);
}

//+------------------------------------------------------------------+
//| Custom indicator deinitialization function                       |
//+------------------------------------------------------------------+
int deinit()
{
   return(0);
}

//+------------------------------------------------------------------+
//| Custom indicator iteration function                              |
//+------------------------------------------------------------------+
int start()
{
   // Start, limit, etc..
   int start = 0;
   int limit;
   int counted_bars = IndicatorCounted();
   if(Bars<=10) return(0);

   // nothing else to do?
   if(counted_bars < 0)
       return(-1);

   // do not check repeated bars
   limit = Bars - 1 - counted_bars;

   // Check heiken ashi for past to present
   for(int pos = limit; pos >= start; pos--)
   {
      // Open and close
      double open = iCustom(Symbol(), 0, "Heiken Ashi", 2, pos);
      double close = iCustom(Symbol(), 0, "Heiken Ashi", 3, pos);

      // Median
      FextMapBuffer4[pos] = (open + close) / 2;

      // Difference
      FextMapBuffer5[pos] = FextMapBuffer4[pos] - FextMapBuffer4[pos+1];

      // If bearish
      if(open > close)
      {
         FextMapBuffer2[pos] = FextMapBuffer5[pos];
         FextMapBuffer1[pos] = 0;

      // If bullish
      } else {

         FextMapBuffer1[pos] = FextMapBuffer5[pos];
         FextMapBuffer2[pos] = 0;
      }
   }

   // Apply average
   for(int i=0; i<Bars; i++) FextMapBuffer3[i] = iMAOnArray(FextMapBuffer5, Bars, AvPeriod, 0, MaMetod, i);
   return(0);
}
Comments