Turbo_JRSX_v1
Download script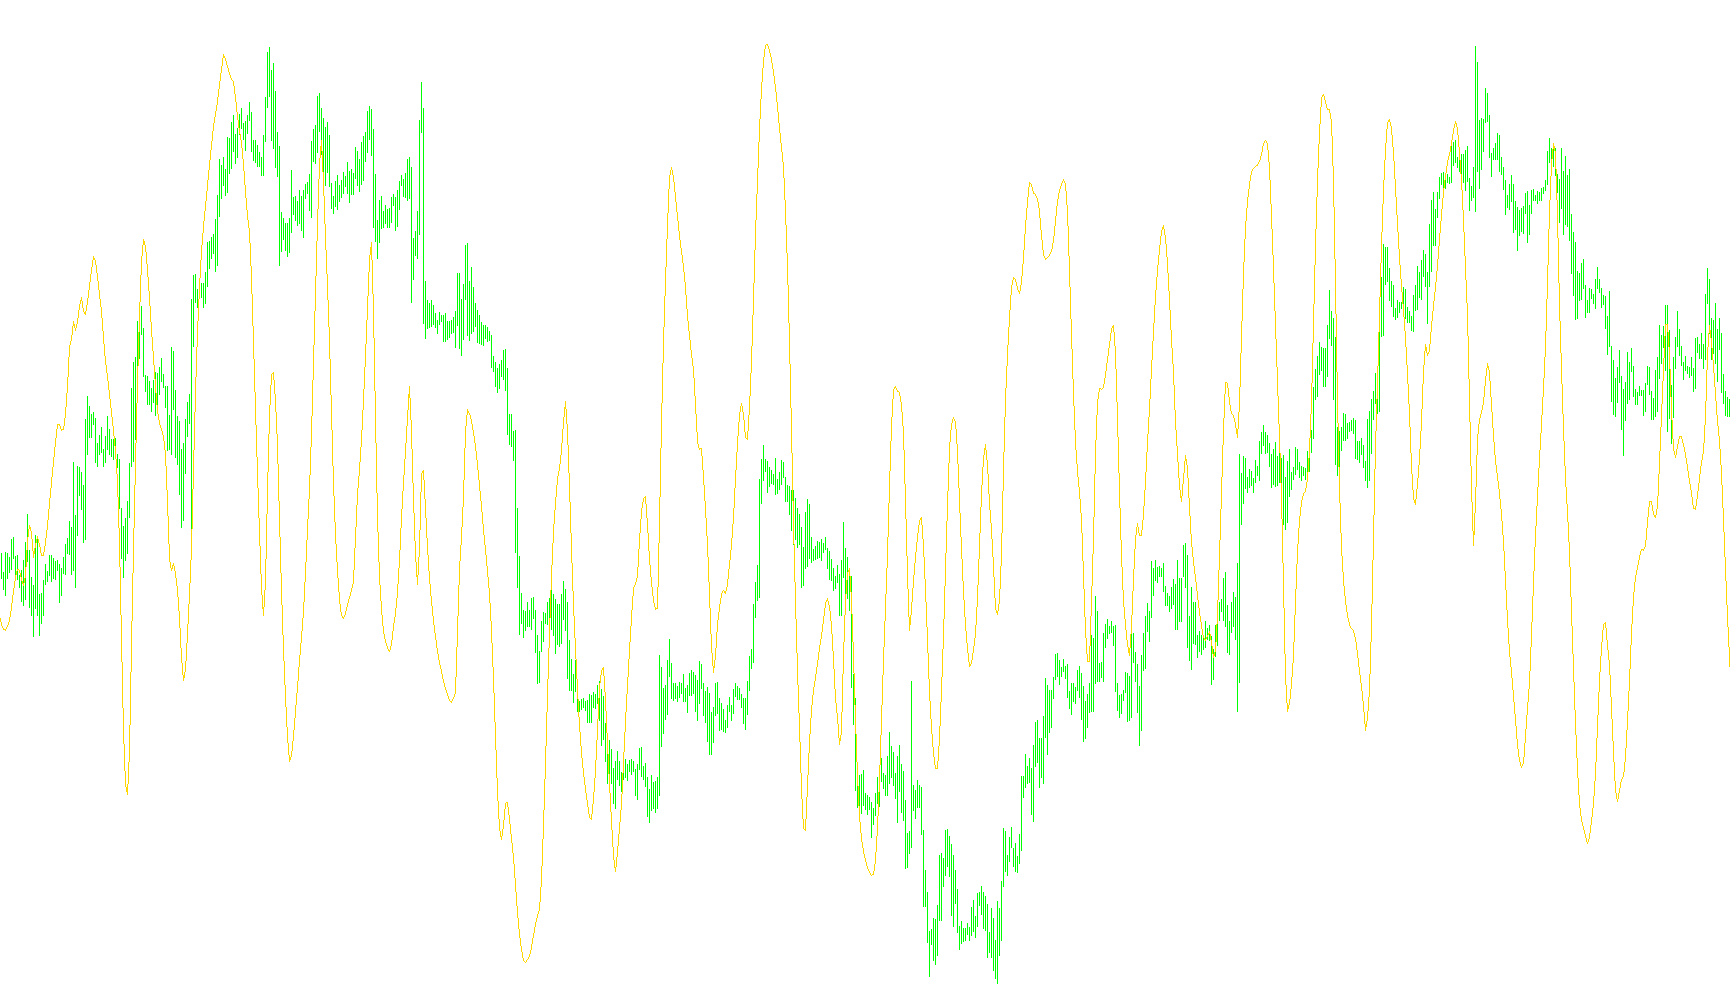
This custom indicator, titled Turbo JRSX, is designed to provide visual insights into market momentum and price trends by processing historical price data into a readable, normalized scale. Unlike standard indicators that might only look at where the price finishes (the "Close"), this script utilizes a more balanced approach to determine value.
Core Logic & Mechanics
1. Price Calculation Method The script specifically uses the Typical Price—which is the average of the High, Low, and Close prices for each time period—rather than just the closing price. By incorporating the highest and lowest points reached during a candle, the logic captures a more comprehensive view of market activity within that specific timeframe.
2. Momentum Smoothing The tool employs a sophisticated multi-layered smoothing process. It calculates the difference between current prices and past values, then runs those differences through several successive cycles of weighted averaging. This "stacking" effect serves to:
- Filter out minor market "noise" or random price flickers.
- Highlight the underlying strength of the trend.
- Ensure that the resulting line moves fluidly rather than jaggedly, making it easier for a trader to identify clear directional shifts.
3. The Absolute Value Filter A unique feature of this logic is its use of "Absolute Values" in certain calculation layers. This allows the script to measure the magnitude of price movement regardless of whether that movement was up or down. This helps the indicator maintain a sense of volatility and strength even when the market is moving sideways or consolidating.
4. Normalization (The 0-100 Scale) To make the data easy to read at a glance, the final calculation converts complex mathematical results into a standardized scale ranging from 0 to 100.
- A value of 50 typically represents a neutral state where no clear momentum is detected.
- Movements toward the top (100) or bottom (0) indicate extreme momentum in either direction.
Visual Interpretation
The result is displayed in a separate window as a magenta line. By observing this line against the predefined levels (30, 50, and 70), users can visually identify when market momentum is accelerating, exhausting, or remaining neutral. It acts as a "speedometer" for price action, providing a smoothed, normalized look at how aggressively the market is moving in a specific direction.
/*-----------------------------+
|			       |
| Shared by www.Aptrafx.com    |
|			       |
+------------------------------*/

#property copyright "strategybuilderfx.com - modified by bluto to use typical price (HLC/3)"
#property link "finger"
#property indicator_separate_window
#property indicator_buffers 1
#property indicator_color1 Magenta
#property indicator_level1 70
#property indicator_level2 30
#property indicator_level3 50
#property indicator_maximum 100
#property indicator_minimum 0

//---- input parameters
extern int Len=14; //---- buffers
double rsx[];


int init() {
   SetIndexStyle(0,DRAW_LINE);
   SetIndexBuffer(0,rsx);
   IndicatorShortName("Turbo_JRSX");
   return(0);
}

int deinit()
{
   return(0);
}

int start()
{

   double f88, f90;
   double f0, v4, v8, vC, v10, v14, v18, v20;
   double f8, f10, f18, f20, f28, f30, f38, f48, v1C;
   double f50, f58, f60, f68, f70, f78, f80, f40;

   //int counted_bars = IndicatorCounted(),limit,shift;

   //if (counted_bars<0) return(-1);
   //if (counted_bars>0) counted_bars--;
   double limit=Bars-(Len)-1;

   //if(counted_bars>Len) limit=Bars-counted_bars-1;

   for (int shift=limit;shift>=0;shift--) {
      if (f90 == 0.0) {

         f90 = 1.0;
         f0 = 0.0;
         if (Len-1 >= 5) f88 = Len-1.0; else f88 = 5.0;
 //      f8 = 100.0*(Close[shift]);
 //
 //      Modified for median price
 //
         f8 = 100.0*((High[shift]+Low[shift]+Close[shift])/3);
         f18 = 3.0 / (Len + 2.0);
         f20 = 1.0 - f18;

      } else{
         if (f88 <= f90) f90 = f88 + 1; else f90 = f90 + 1;
         f10 = f8;
 //      f8 = 100*Close[shift];
         f8 = 100.0*((High[shift]+Low[shift]+Close[shift])/3);
         v8 = f8 - f10;
         f28 = f20 * f28 + f18 * v8;
         f30 = f18 * f28 + f20 * f30;
         vC = f28 * 1.5 - f30 * 0.5;
         f38 = f20 * f38 + f18 * vC;
         f40 = f18 * f38 + f20 * f40;
         v10 = f38 * 1.5 - f40 * 0.5;
         f48 = f20 * f48 + f18 * v10;
         f50 = f18 * f48 + f20 * f50;
         v14 = f48 * 1.5 - f50 * 0.5;
         f58 = f20 * f58 + f18 * MathAbs(v8);
         f60 = f18 * f58 + f20 * f60;
         v18 = f58 * 1.5 - f60 * 0.5;
         f68 = f20 * f68 + f18 * v18;

         f70 = f18 * f68 + f20 * f70;
         v1C = f68 * 1.5 - f70 * 0.5;
         f78 = f20 * f78 + f18 * v1C;
         f80 = f18 * f78 + f20 * f80;
         v20 = f78 * 1.5 - f80 * 0.5;

         if ((f88 >= f90) && (f8 != f10)) f0 = 1.0;
         if ((f88 == f90) && (f0 == 0.0)) f90 = 0.0;
      }

      if ((f88 < f90) && (v20 > 0.0000000001)) {

         v4 = (v14 / v20 + 1.0) * 50.0;
         if (v4 > 100.0) v4 = 100.0;
         if (v4 < 0.0) v4 = 0.0;

      } else {
         v4 = 50.0;
      }

      rsx[shift]=v4;
   }

   return(0);

}
Comments