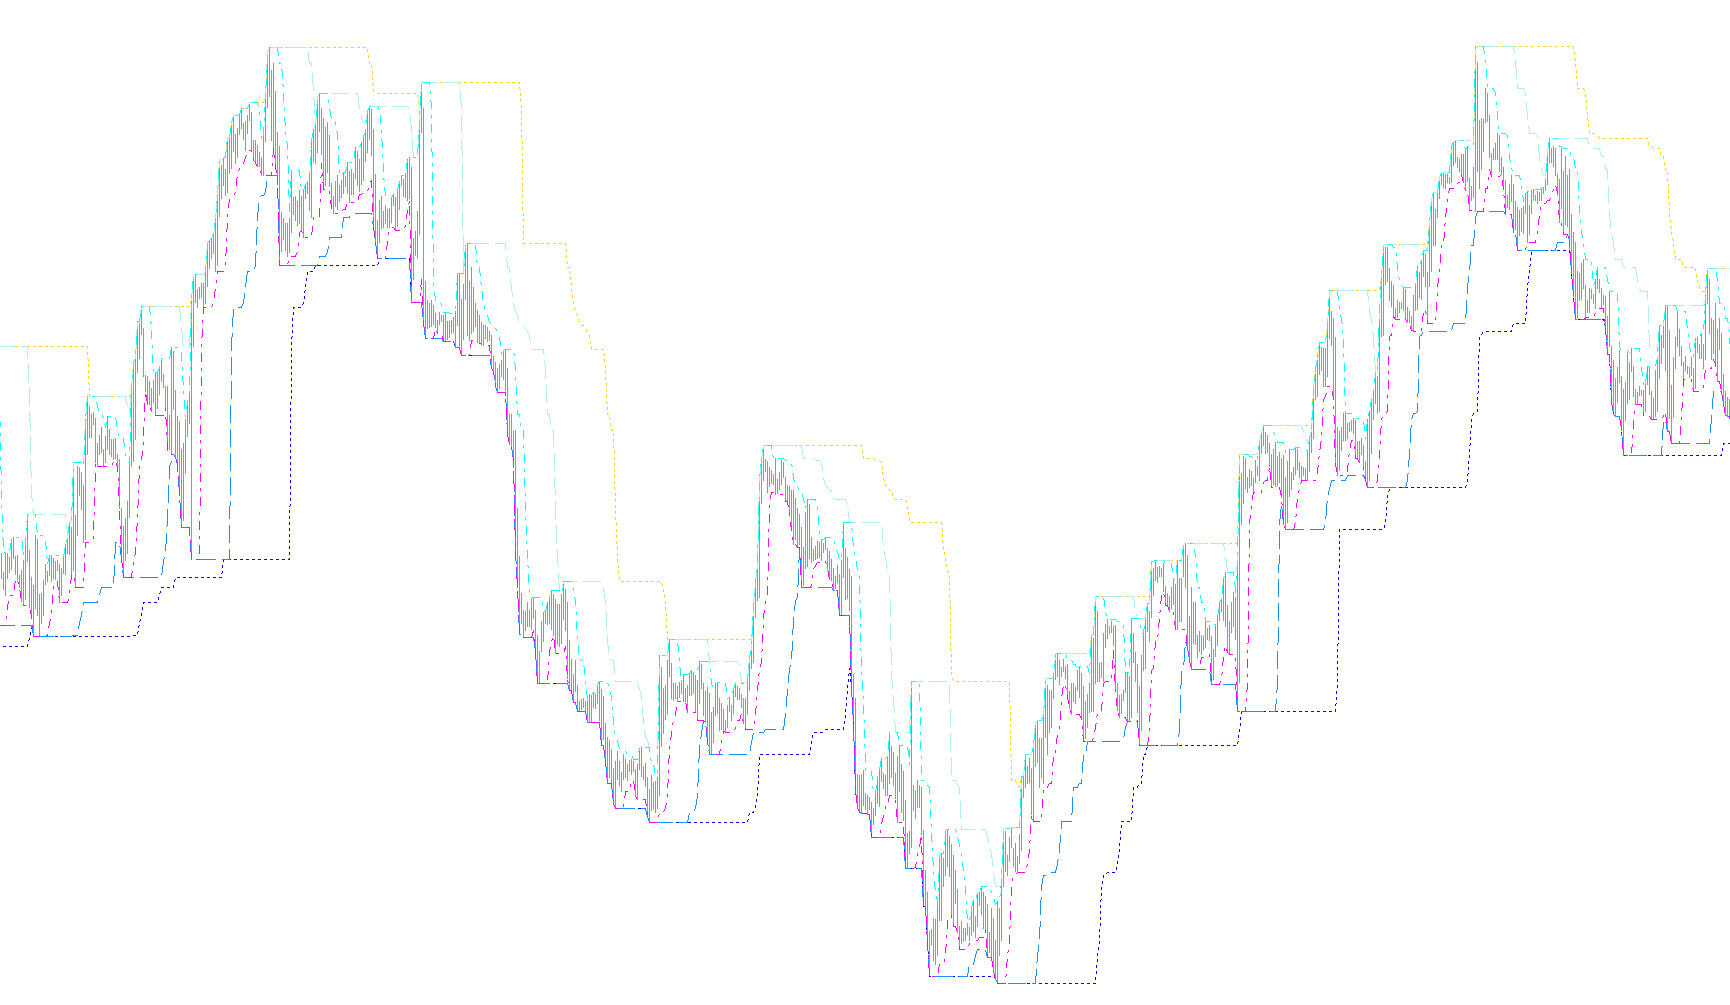
This script is designed to provide traders with a visual representation of price boundaries, known as Donchian Channels. By identifying the highest highs and lowest lows over specific periods, it helps market participants understand the current range of price movement and identify potential breakout points or trend reversals.
Core Logic and Functionality
The tool operates by creating three distinct sets of "channels" simultaneously on your chart, each representing a different timeframe of price history:
- Short-Term Channel: Focuses on very recent price action (e.g., the last 5 bars) to identify immediate volatility.
- Medium-Term Channel: Monitors a broader range of activity (e.g., the last 20 bars) to capture mid-range trends.
- Long-Term Channel: Tracks significant price extremes over an extended period (e.g., the last 50 bars) to define the overall market structure.
Key Customization Features
The script offers several ways to fine-tune how these boundaries are calculated:
1. Extreme Point Selection You can choose which specific price data points define the top and bottom of the channels:
- Highs/Lows: Uses the absolute highest and lowest prices reached.
- Open Prices: Focuses on the opening prices of those extreme bars, which can be useful for seeing where a significant move originated.
- Median Points: Calculates a midpoint between the opening price and the high/low of the extreme bars to provide a balanced boundary.
2. Margin Adjustments The script includes a "Margin" feature that allows you to create a buffer zone. Instead of plotting the absolute peak or trough, it can calculate a percentage-based offset inward from the border. This helps in creating a "safety zone" before a price is considered to have officially broken out of its historical range.
3. Advance and Historical Scope The logic allows for an "Advance" setting to shift the lines forward or backward on the chart and a maximum bar count to ensure the indicator remains efficient by only processing as much historical data as necessary.
Visual Representation
To keep the chart organized, the script distinguishes between these three timeframes using different line styles and colors (such as dotted, dashed, and dash-dotted lines). This allows you to see at a glance where the price sits relative to short-term noise versus long-term market trends.
//+------------------------------------------------------------------+
//|                              Turtle Channel Method(Donchain).mq4 |
//|                                           djindyFX@sbcglobal.net |
//|      http://www.learncurrencytrading.com/fxforum/blogs/djindyfx/ |
//+------------------------------------------------------------------+
#property copyright "djindyFX@yahoo.com"
#property link      "http://www.learncurrencytrading.com/fxforum/blogs/djindyfx/"
/* - Original Donchain channel code posted here: http://codebase.mql4.com/ru/1317
      Periods: number of bars used for calculating the Donchian channels
               3 Seperate Channels are provided, Long term, Medium, and Short Term
      Extremes: 1 uses the highest high and the lowest low to create the Channel
                0 uses the open of the extremes bar -> the open point of a bar (as well as the close
                   are the points of maximum probability of concentration of the prices during the bar
                3 uses the median point most extreme open and lowest low or highest high
      Margins: is the percent of the channel subtrated from the channel border before printing it, negative values are allowed
      Advance: the numbers of bars ahead
*/


#property indicator_chart_window
#property indicator_buffers 6
#property indicator_color1 White
#property indicator_color2 White
#property indicator_color3 Yellow
#property indicator_color4 Yellow
#property indicator_color5 Red
#property indicator_color6 Red

//---- input parameters
extern int       LngPeriod=50;
extern int       MedPeriod=20;
extern int       ShtPeriod=5;
extern int       Extremes=1;
extern int       Margins=0;
extern int       Advance=0;
extern int       max_bars=1400;

// - Buffers
double Channel1[];
double Channel2[];
double Channel3[];
double Channel4[];
double Channel5[];
double Channel6[];

//+------------------------------------------------------------------+
//| Custom indicator initialization function                         |
//+------------------------------------------------------------------+
int init()
  {
  Comment("Turtle Channel is running");
  string LngTop, LngBottom, MedTop, MedBottom, ShtTop, ShtBottom;

//---- indicators
   SetIndexStyle(0,DRAW_LINE,STYLE_DOT);
   SetIndexStyle(1,DRAW_LINE,STYLE_DOT);
   SetIndexStyle(2,DRAW_LINE,STYLE_DASH);
   SetIndexStyle(3,DRAW_LINE,STYLE_DASH);
   SetIndexStyle(4,DRAW_LINE,STYLE_DASHDOT);
   SetIndexStyle(5,DRAW_LINE,STYLE_DASHDOT);

   SetIndexBuffer(0,Channel1);
   SetIndexBuffer(1,Channel2);
   SetIndexBuffer(2,Channel3);
   SetIndexBuffer(3,Channel4);
   SetIndexBuffer(4,Channel5);
   SetIndexBuffer(5,Channel6);

   LngTop = "Long Top";
   LngBottom = "Long Bottom";
   MedTop = "Medium Top";
   MedBottom = "Medium Bottom";
   ShtTop = "Short Top";
   ShtBottom = "Short Bottom";

   IndicatorShortName(LngTop);
   IndicatorShortName(LngBottom);
   IndicatorShortName(MedTop);
   IndicatorShortName(MedBottom);
   IndicatorShortName(ShtTop);
   IndicatorShortName(ShtBottom);

   SetIndexLabel(0,LngTop);
   SetIndexLabel(1,LngBottom);
   SetIndexLabel(2,MedTop);
   SetIndexLabel(3,MedBottom);
   SetIndexLabel(4,ShtTop);
   SetIndexLabel(5,ShtBottom);

//----
   return(0);
  }
//+------------------------------------------------------------------+
//| Custom indicator deinitialization function                       |
//+------------------------------------------------------------------+
int deinit()
  {
//----

//----
   return(0);
  }
//+------------------------------------------------------------------+
//| Custom indicator iteration function                              |
//+------------------------------------------------------------------+
int start()
  {
   int   counted_bars=IndicatorCounted();
   if    (counted_bars < 0) return(-1);
   if    (counted_bars>0) counted_bars--;

   double   sminl=0, smaxl=0, SsMinl=0, SsMaxl=0;
   double   sminm=0, smaxm=0, SsMinm=0, SsMaxm=0;
   double   smins=0, smaxs=0, SsMins=0, SsMaxs=0;

//----

   for(int shift = 0; shift< max_bars; shift++)
   {
      if(Extremes ==1)
      {
         SsMaxl = High[iHighest(NULL,0,MODE_HIGH,LngPeriod,shift)];
         SsMinl = Low[iLowest(NULL,0,MODE_LOW,LngPeriod,shift)];
         SsMaxm = High[iHighest(NULL,0,MODE_HIGH,MedPeriod,shift)];
         SsMinm = Low[iLowest(NULL,0,MODE_LOW,MedPeriod,shift)];
         SsMaxs = High[iHighest(NULL,0,MODE_HIGH,ShtPeriod,shift)];
         SsMins = Low[iLowest(NULL,0,MODE_LOW,ShtPeriod,shift)];
      }
      else if (Extremes ==3)
      {
         SsMaxl = (Open[iHighest(NULL,0,MODE_OPEN,LngPeriod,shift)]+High[iHighest(NULL,0,MODE_HIGH,LngPeriod,shift)])/2;
         SsMinl = (Open[iLowest(NULL,0,MODE_OPEN,LngPeriod,shift)]+Low[iLowest(NULL,0,MODE_LOW,LngPeriod,shift)])/2;
         SsMaxm = (Open[iHighest(NULL,0,MODE_OPEN,MedPeriod,shift)]+High[iHighest(NULL,0,MODE_HIGH,MedPeriod,shift)])/2;
         SsMinm = (Open[iLowest(NULL,0,MODE_OPEN,MedPeriod,shift)]+Low[iLowest(NULL,0,MODE_LOW,MedPeriod,shift)])/2;
         SsMaxs = (Open[iHighest(NULL,0,MODE_OPEN,ShtPeriod,shift)]+High[iHighest(NULL,0,MODE_HIGH,ShtPeriod,shift)])/2;
         SsMins = (Open[iLowest(NULL,0,MODE_OPEN,ShtPeriod,shift)]+Low[iLowest(NULL,0,MODE_LOW,ShtPeriod,shift)])/2;
      }
      else
      {
         SsMaxl = Open[iHighest(NULL,0,MODE_OPEN,LngPeriod,shift)];
         SsMinl = Open[iLowest(NULL,0,MODE_OPEN,LngPeriod,shift)];
         SsMaxm = Open[iHighest(NULL,0,MODE_OPEN,MedPeriod,shift)];
         SsMinm = Open[iLowest(NULL,0,MODE_OPEN,MedPeriod,shift)];
         SsMaxs = Open[iHighest(NULL,0,MODE_OPEN,ShtPeriod,shift)];
         SsMins = Open[iLowest(NULL,0,MODE_OPEN,ShtPeriod,shift)];
      }

     smaxl = SsMaxl-(SsMaxl-SsMinl)*Margins/100;
     sminl = SsMinl+(SsMaxl-SsMinl)*Margins/100;
     smaxm = SsMaxm-(SsMaxm-SsMinm)*Margins/100;
     sminm = SsMinm+(SsMaxm-SsMinm)*Margins/100;
     smaxs = SsMaxs-(SsMaxs-SsMins)*Margins/100;
     smins = SsMins+(SsMaxs-SsMins)*Margins/100;

     Channel1[shift-Advance]=smaxl;
     Channel2[shift-Advance]=sminl;
     Channel3[shift-Advance]=smaxm;
     Channel4[shift-Advance]=sminm;
     Channel5[shift-Advance]=smaxs;
     Channel6[shift-Advance]=smins;
   }


//----
   return(0);
  }
//+------------------------------------------------------------------+
Comments