UberfractalV02
Download script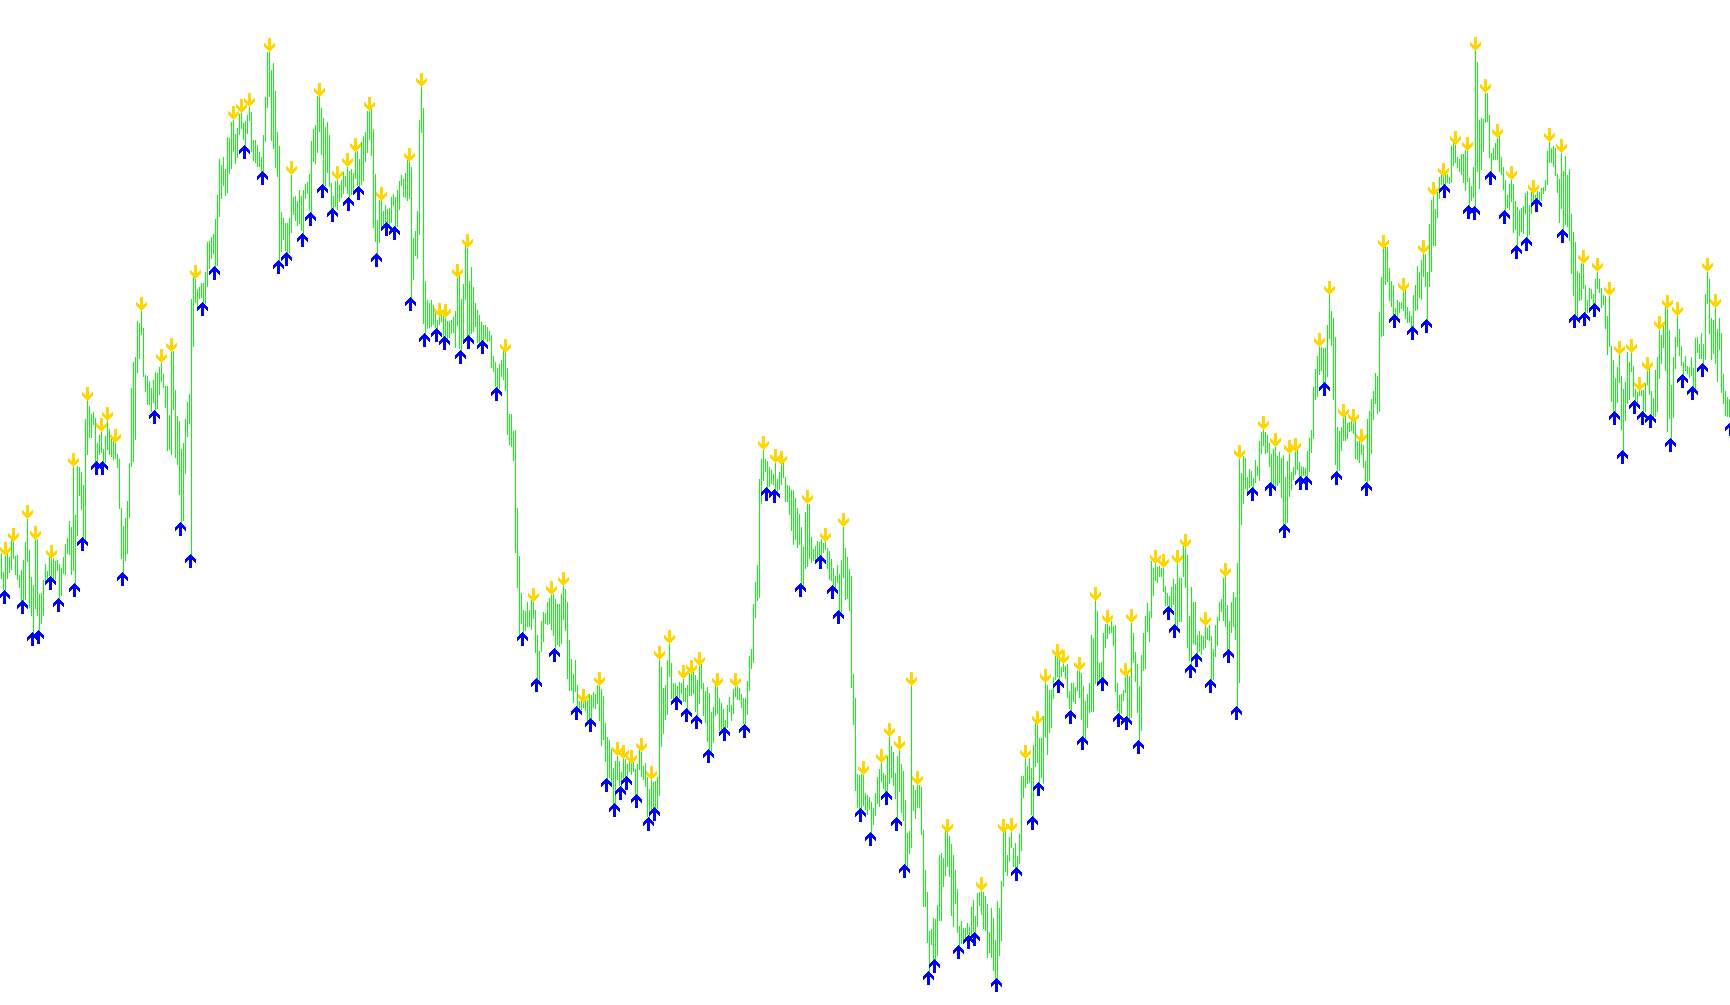
This tool is designed to serve as a visual guide for traders by automatically identifying significant structural "peaks" and "valleys" on a price chart. Instead of cluttering the screen with constant noise, it focuses on highlighting specific historical price points where the market reached a local extreme.
How the Logic Works
The script scans the historical price data to find high and low points based on a defined window of surrounding bars. Think of it as looking at a specific section of the chart and asking: "Is this specific candle the highest or lowest in its immediate neighborhood?"
1. Identifying High Points (Sell Signals) The logic looks for candles that reach a peak price higher than those immediately preceding and following them. When the script confirms that a candle is the "highest" within this defined range, it places a red visual marker above that point. This helps traders identify potential areas of resistance or price exhaustion.
2. Identifying Low Points (Buy Signals) Conversely, the script searches for candles that hit a valley—prices lower than the neighboring bars in the same range. When it detects one of these local lows, it places a lime-colored visual marker below the candle. This is intended to highlight potential areas of support or price "bottoming out."
3. Precision and Spacing To ensure the markers are easy to read and do not overlap with the actual candles, the script includes two specific behaviors:
- Offsetting: It automatically places the markers a short distance above or below the candle so they remain clearly visible.
- Contextual Awareness: By requiring the identified peak or valley to be the absolute highest/lowest within a set number of bars, it filters out minor fluctuations and highlights only the most relevant price turning points.
Summary for the User
Essentially, this script acts as an automated "highlighter." It sweeps across your chart history to mark every significant top and bottom, providing you with a clear visual map of where the market has previously shifted direction or hit a limit.
//+------------------------------------------------------------------+
//|                                                super-signals.mq4 |
//|                Copyright © 2006, Nick Bilak, beluck[AT]gmail.com |
//+------------------------------------------------------------------+
#property copyright "Copyright © 2006, Nick Bilak"
#property link      "http://www.forex-tsd.com/"

#property indicator_chart_window
#property indicator_buffers 2
#property indicator_color1 Red
#property indicator_width1 2
#property indicator_color2 Lime
#property indicator_width2 2


extern int barsLeftOfCurrent = 2;
extern int barsRightOfCurrent = 2;
extern int SignalGap = 3;

int dist=24;

double b1[];
double b2[];

int init()  {
   SetIndexStyle(0,DRAW_ARROW,STYLE_SOLID,1);
   SetIndexStyle(1,DRAW_ARROW,STYLE_SOLID,1);
   SetIndexArrow(1,233);
   SetIndexArrow(0,234);
   SetIndexBuffer(0,b1);
   SetIndexBuffer(1,b2);
   return(0);
}
int start() {
   int counted_bars=IndicatorCounted();
   int k,i,j,limit,hhb,llb;

   if (counted_bars<0) return(-1);
   if (counted_bars>0) counted_bars--;
   limit=Bars-1;
   if(counted_bars>=1) limit=Bars-counted_bars-1;
   if (limit<0) limit=0;

   for (i=limit;i>=0;i--)   {
//      b1[i]=EMPTY_VALUE;
//      b2[i]=EMPTY_VALUE;
      b1[i]=0;
      b2[i]=0;
      hhb = iHighest(0,0,MODE_HIGH,barsLeftOfCurrent + 1 + barsRightOfCurrent,i - barsRightOfCurrent);
      llb = iLowest(0,0,MODE_LOW,barsLeftOfCurrent + 1 + barsRightOfCurrent,i - barsRightOfCurrent);

      if (i==hhb)
         b1[i]=High[hhb]+SignalGap*Point;
      if (i==llb)
         b2[i]=Low[llb]-SignalGap*Point;
   }
   return(0);
}
Comments