Urovny
Download script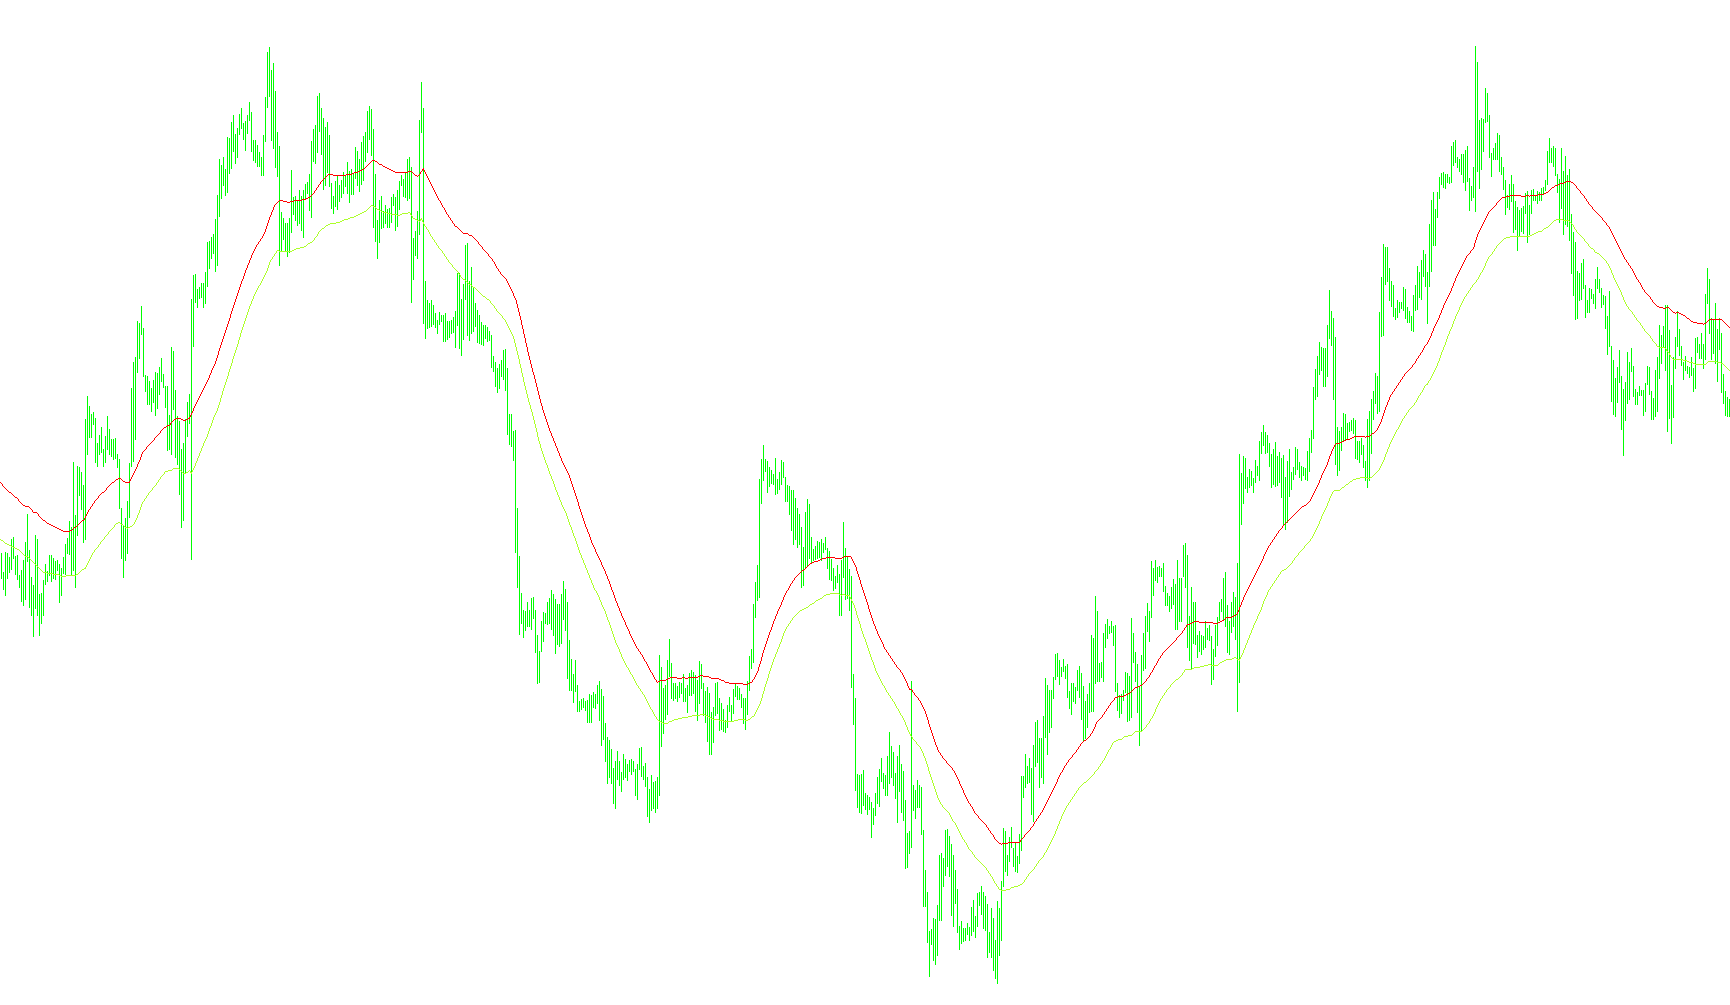
This tool is designed to provide visual guidance on a trading chart by identifying specific price boundaries based on recent market activity. It functions by calculating moving averages derived from the highest and lowest price points over a specific period, creating a "channel" that helps traders visualize price extremes.
How the Logic Works
1. Dynamic Price Tracking The script looks back at a user-defined number of historical candles (the "period"). Instead of looking at the standard closing price, it identifies the highest and lowest points reached during that timeframe. By focusing on these extremes, the tool helps capture the true range of market volatility.
2. Trend Smoothing To prevent the visual markers from jumping erratically with every small price tick, the script applies an Exponential Moving Average (EMA). This smooths out the data, creating fluid lines that follow the general trend of the high and low prices rather than reacting to momentary noise.
3. Custom Buffer Zones The logic allows for a specific "delta" adjustment. This essentially creates a padded safety zone above the high-side line and below the low-side line. By adding or subtracting this value, the tool generates a wider corridor, providing a clearer picture of the market's boundaries.
4. Visual Representation The results are displayed on your chart as two distinct lines:
- Upper Boundary: Calculated based on the high prices plus the adjustment buffer.
- Lower Boundary: Calculated based on the low prices minus the adjustment buffer.
Key Components for User Configuration
- Period: Determines how far back into the past the script looks to calculate the averages (the longer the period, the smoother and slower the lines will be).
- Delta: Controls the thickness of the "buffer" or the distance between the calculated average and the plotted line.
- Correction: A fine-tuning value that allows for a manual shift of both lines simultaneously to account for specific market nuances.
In summary, this script acts as a dynamic envelope. It helps traders identify "ceiling" and "floor" levels in real-time, making it easier to see where the market is trending and where it might be reaching overextended territory.
//+------------------------------------------------------------------+
//|                                                       Urovni.mq4 |
//|                                  forextimes, MojoFX - Conversion |
//|                                                        fxtest.ru |
//+------------------------------------------------------------------+
#property copyright "forextimes, MojoFX - Conversion"
#property link      "fxtest.ru"
//----
#property indicator_chart_window
#property indicator_buffers 2
#property indicator_color1 Red
#property indicator_color2 GreenYellow
//----
extern int per=60;
extern int delta=10;
extern int korr=0;
//---- buffers
double Buffer1[];
double Buffer2[];
double TB[];
//+------------------------------------------------------------------+
//| Custom indicator initialization function                         |
//+------------------------------------------------------------------+
int init()
  {
//---- indicators
   IndicatorBuffers(3);
   SetIndexStyle(0,DRAW_LINE,STYLE_SOLID,1,indicator_color1);
   SetIndexBuffer(0,Buffer1);
   SetIndexStyle(1,DRAW_LINE,STYLE_SOLID,1,indicator_color2);
   SetIndexBuffer(1,Buffer2);
   SetIndexBuffer(2,TB);
//----
   return(0);
  }
//+------------------------------------------------------------------+
//| Custom indicator iteration function                              |
//+------------------------------------------------------------------+
int start()
  {
   int counted_bars=IndicatorCounted();
   if (counted_bars<0) return(-1);
   if (counted_bars>0) counted_bars--;
//----
   int limit=Bars-per-counted_bars;
//----
   for(int i=limit; i>=0; i--)
     {
      Buffer1[i]=iMA(NULL,0,per,0,MODE_EMA,PRICE_HIGH,i) + delta*Point + korr*Point;
      Buffer2[i]=iMA(NULL,0,per,0,MODE_EMA,PRICE_LOW,i) - delta*Point + korr*Point;
      Comment(limit," ",Close[0]," ",TB[0]," ",delta*Point," ",korr*Point);
     }
//----
   return(0);
  }
//+------------------------------------------------------------------+
Comments