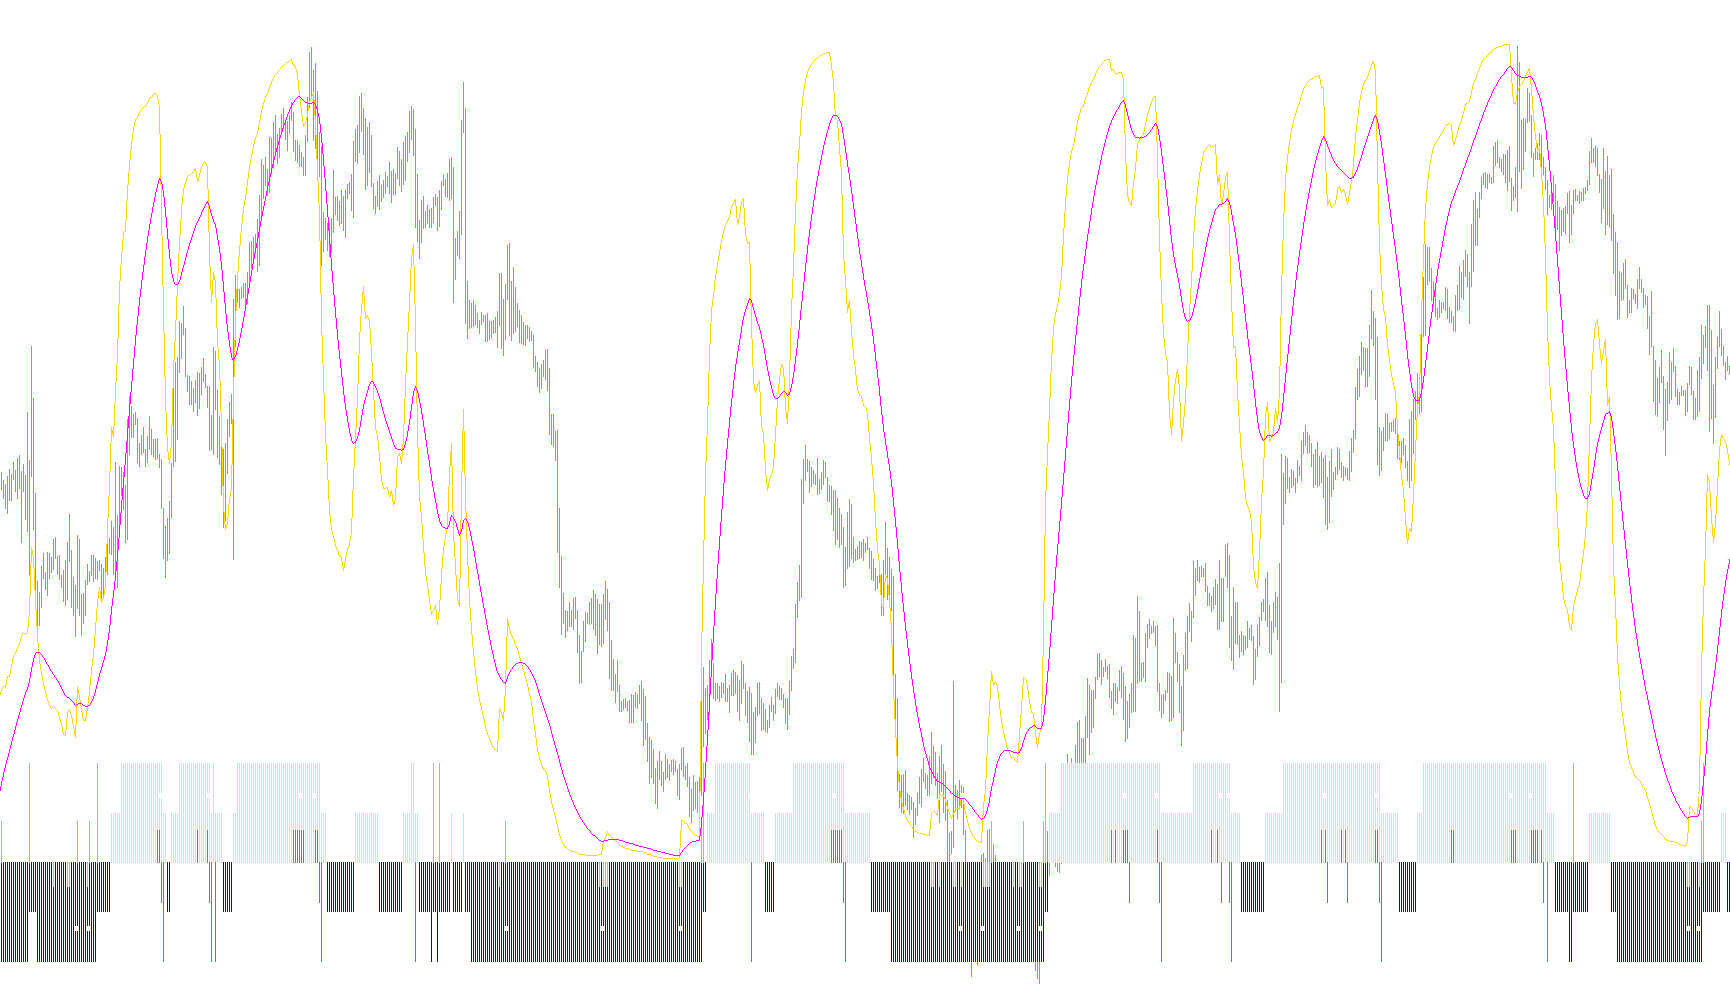
The RSIOMA v2HHLSX is a sophisticated technical analysis tool designed to help traders visualize market momentum, identify trend reversals, and pinpoint potential entry or exit zones. It builds upon the standard Relative Strength Index (RSI) by adding layers of moving averages and visual signals to filter out market "noise" and highlight significant price actions.
Here is a breakdown of the logic used by this script:
Core Momentum Tracking
At its foundation, the script calculates a modified RSI value. Unlike a standard RSI which looks directly at price, this version processes data through a Moving Average first. This smoothing effect helps in identifying the underlying strength of a trend without being overly reactive to every minor price fluctuation.
Trend Identification & Visual Zones
The indicator creates several distinct visual layers to help users understand the "health" of the current market:
- Trend Dynamics: It utilizes specific thresholds (such as 30 and 70) to distinguish between long-term bullish and bearish trends. These are represented by histogram elements that grow in different directions, giving you a clear sense of whether the momentum is favoring buyers or sellers.
- The "Major" Midline: A central level acts as a baseline (50). The script monitors whether the momentum stays above or below this point to determine the primary market bias.
- Trigger Zones: The tool highlights extreme areas (high and low boundaries) using colored dots and lines. These represent "Overbought" and "Oversold" conditions where the price may be stretched too far in one direction.
Signal Generation Logic
The script is designed to alert traders to specific shifts in momentum through two primary methods:
- Crossovers: It calculates a secondary moving average of the RSI (the "MaRsioma"). When the main momentum line crosses over this average line, the script generates visual markers (arrows). These crossovers suggest a shift in strength—moving from bearish to bullish or vice versa.
- Reversal Detection: The logic tracks specific price "re-entries." For example, if the momentum drops into a very low zone but then begins to tick upward, it identifies a potential reversal point. Conversely, if it reaches an extremely high zone and begins to dip, it signals a potential cooling off or downward turn.
Visual Summary for the User
Instead of just providing a single line, this script paints a comprehensive picture on your chart:
- Lines and Levels: Provide constant reference points for extreme highs, lows, and trend boundaries.
- Histograms: Provide a real-time view of whether current momentum is pushing up or down relative to the trend.
- Arrows/Signals: Act as "triggers" to highlight the exact moments when momentum shifts are confirmed by the crossover logic.
//+--------------------------------------------------------------------------------+
//|                                                                 RSIOMA v2HHLSX |
//|                                                            Kalenzo - fxtsd.com |
//|     Hornet(i-RSI)2007, FxTSD.com;                 MetaQuotes Software Corp. ik |
//|     Hist & Levels 20/80;30/70 CrossSig            web: http://www.fxservice.eu |
//|     Rsioma/MaRsioma X sig                   email: bartlomiej.gorski@gmail.com |
//|                                                                                |
//|     The base for this indicator was orginal RSI attached with Metatrader       |
//|                                             ^^ removed ^^ :)|-<   Hornet       |
//+--------------------------------------------------------------------------------+
#property copyright "Copyright © 2007, MetaQuotes Software Corp."
#property link      "http://www.metaquotes.net/"
//----
#property indicator_separate_window
#property indicator_minimum -20
#property indicator_maximum 120
#property indicator_buffers 7
//----
#property indicator_color1 Blue
#property indicator_color2 Red
#property indicator_color3 Green
#property indicator_color4 Magenta
#property indicator_color5 DodgerBlue
#property indicator_color6 BlueViolet
#property indicator_color7 SlateBlue //RoyalBlue
//#property indicator_color8 MediumSlateBlue
#property indicator_width1 2
#property indicator_width4 2
#property indicator_width5 2
#property indicator_width7 2
#property indicator_level1 100
#property indicator_level2 80
//#property indicator_level3 70
#property indicator_level4 50
//#property indicator_level5 30
#property indicator_level6 20
#property indicator_level7 0
#property indicator_levelcolor  SlateGray
//---- input parameters
extern int RSIOMA         =14;
extern int RSIOMA_MODE    =MODE_EMA;
extern int RSIOMA_PRICE   =PRICE_CLOSE;
extern int Ma_RSIOMA      =21,
           Ma_RSIOMA_MODE =MODE_EMA;
extern double BuyTrigger     =80.00;
extern double SellTrigger    =20.00;
extern color BuyTriggerColor =DodgerBlue;
extern color SellTriggerColor=Magenta;
extern double MainTrendLong  =70.00;
extern double MainTrendShort =30.00;
extern color MainTrendLongColor    =Red;
extern color MainTrendShortColor   =Green;
extern double MajorTrend  =50;
extern color marsiomaXSigColor  =SlateBlue;
//extern color marsiomaXdnSigColor   = MediumSlateBlue;
//---- buffers
double RSIBuffer[];
double MABuffer1[];
double bdn[],bup[];
double sdn[],sup[];
double marsioma[];
double marsiomaXSig[];
//double marsiomaXdnSig[];
string short_name;
//+------------------------------------------------------------------+
//| Custom indicator initialization function                         |
//+------------------------------------------------------------------+
int init()
  {
   short_name=StringConcatenate("RSIOMA(",RSIOMA,")");
   IndicatorBuffers(8);
   SetIndexBuffer(0,RSIBuffer);
   SetIndexBuffer(2,bup);
   SetIndexBuffer(1,bdn);
   SetIndexBuffer(3,sdn);//Magnet
   SetIndexBuffer(4,sup);//DodgerBlue
   SetIndexBuffer(5,marsioma);
   SetIndexBuffer(6,marsiomaXSig);
   //  SetIndexBuffer(7,marsiomaXdnSig);
   SetIndexBuffer(7,MABuffer1);
   SetIndexStyle(0,DRAW_LINE);
   SetIndexStyle(2,DRAW_HISTOGRAM);
   SetIndexStyle(1,DRAW_HISTOGRAM);
   SetIndexStyle(3,DRAW_HISTOGRAM);
   SetIndexStyle(4,DRAW_HISTOGRAM);
   SetIndexStyle(5,DRAW_LINE);
   SetIndexStyle(6,DRAW_ARROW);
   //  SetIndexStyle(7,DRAW_ARROW);
   SetIndexArrow(6,159);//85,88,251(x),252';108,158,159(dot);161,162(crcl);110,167(sq);176-179('scope');11-113,250(hlwSq)
   //  SetIndexArrow(7,159);
   //  SetIndexEmptyValue(6,EMPTY_VALUE);
   //   SetIndexEmptyValue(7,EMPTY_VALUE);
   SetIndexLabel(0,"Rsioma");
   SetIndexLabel(5,"MaRsioma");
   SetIndexLabel(1,"TrendDn");
   SetIndexLabel(2,"TrendUp");
   SetIndexLabel(6,"Up/DnXsig");
   IndicatorShortName(short_name);
   SetIndexDrawBegin(0,RSIOMA);
   SetIndexDrawBegin(1,RSIOMA);
   SetIndexDrawBegin(2,RSIOMA);
   SetIndexDrawBegin(3,RSIOMA);
   SetIndexDrawBegin(4,RSIOMA);
   SetIndexDrawBegin(5,RSIOMA);
   SetIndexDrawBegin(6,RSIOMA);
   SetIndexDrawBegin(7,RSIOMA);
//----
   drawLine(BuyTrigger,"BuyTrigger", BuyTriggerColor);
   drawLine(SellTrigger,"SellTrigger", SellTriggerColor );
   drawLine(MainTrendLong,"MainTrendLong", MainTrendLongColor );
   drawLine(MainTrendShort,"MainTrendShort",MainTrendShortColor );
   return(0);
  }
//+------------------------------------------------------------------+
//| Relative Strength Index                                          |
//+------------------------------------------------------------------+
int start()
  {
   int   i, ii;
   int   counted_bars=IndicatorCounted();
   double rel,negative,positive;
//----
   if(Bars<=RSIOMA) return(0);
//---- initial zero
   if(counted_bars<1)
      for(i=1;i<=RSIOMA;i++) {RSIBuffer[Bars-i]=0.0;}
//----
   ii=Bars-RSIOMA-1;
   if(counted_bars>=RSIOMA) ii=Bars-counted_bars-1;
   i=ii;
   while(i>=0)
     {  MABuffer1[i]=iMA(Symbol(),0,RSIOMA,0,RSIOMA_MODE,RSIOMA_PRICE,i);
     i--;  }
   i=ii;
   while(i>=0)
     {  RSIBuffer[i]=iRSIOnArray(MABuffer1,0,RSIOMA,i);
      if(RSIBuffer[i]>50)          bup[i]=6;
      if(RSIBuffer[i]<50)          bdn[i]=-6;
      if(RSIBuffer[i] > MainTrendLong)                   bup[i]=12;
      if(RSIBuffer[i] < MainTrendShort)                  bdn[i]=-12;
      if(RSIBuffer[i]<20 && RSIBuffer[i]>RSIBuffer[i+1]) sup[i]=-3;
      if(RSIBuffer[i]>80 && RSIBuffer[i]<RSIBuffer[i+1]) sdn[i]=4;
      if(RSIBuffer[i]>20 && RSIBuffer[i+1]<=20)    sup[i]=5;
      if(RSIBuffer[i+1]>=80 && RSIBuffer[i]<80)    sdn[i]=-5;
      if(RSIBuffer[i+1]<=MainTrendShort && RSIBuffer[i]>MainTrendShort)  sup[i]=12;
      if(RSIBuffer[i]<MainTrendLong && RSIBuffer[i+1]>=MainTrendLong)   sdn[i]=-12;
     i--;  }
   i=ii;
   while(i>=0)
     {  marsioma[i]=iMAOnArray(RSIBuffer,0,Ma_RSIOMA,0,Ma_RSIOMA_MODE,i);
      marsiomaXSig[i]=EMPTY_VALUE;
      //marsiomaXdnSig[i] = EMPTY_VALUE;
      if(RSIBuffer[i+1]<=marsioma[i+1]&&RSIBuffer[i]>marsioma[i]) marsiomaXSig[i]=-8;
      if(RSIBuffer[i+1]>=marsioma[i+1]&&RSIBuffer[i]<marsioma[i]) marsiomaXSig[i]=8;
     i--;}
//----
   return(0);
  }
//+------------------------------------------------------------------+
void drawLine(double lvl,string name, color Col )
  {
   ObjectDelete(name);
   ObjectCreate(name, OBJ_HLINE, WindowFind(short_name), Time[0], lvl,Time[0], lvl);
   ObjectSet(name, OBJPROP_STYLE, STYLE_DOT);
   ObjectSet(name, OBJPROP_COLOR, Col);
   ObjectSet(name,OBJPROP_WIDTH,1);
  }
//+------------------------------------------------------------------+
Comments