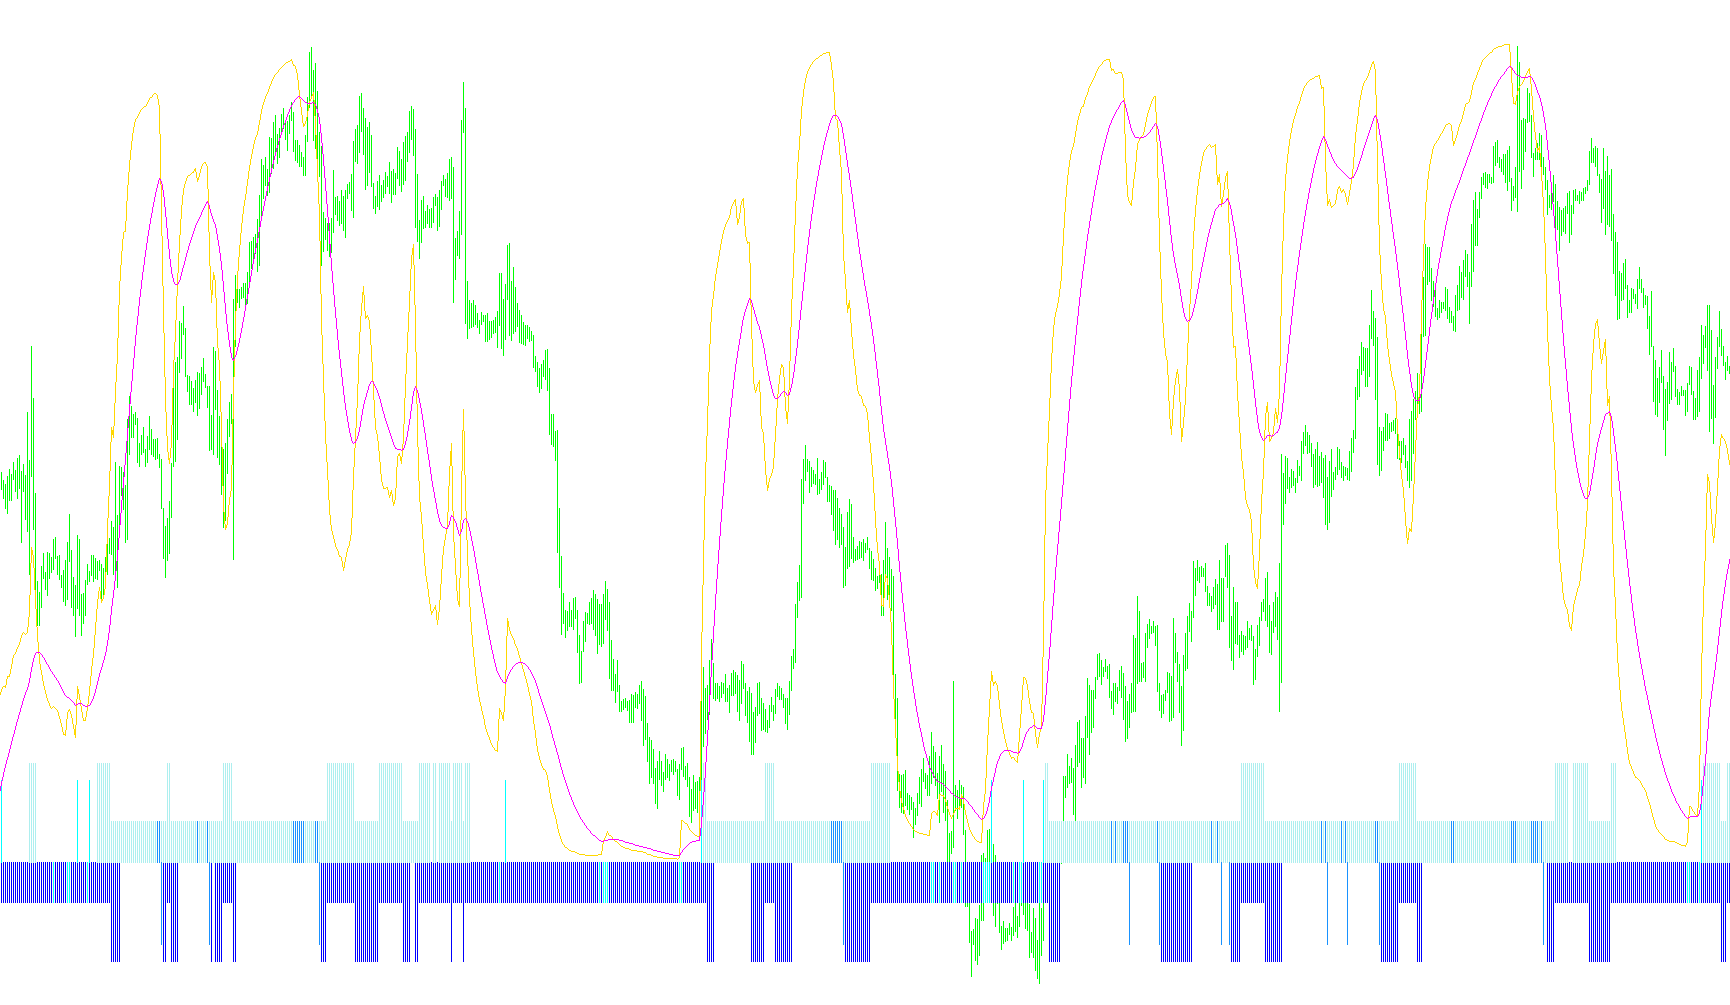
This technical indicator is designed to help traders analyze market momentum and identify potential turning points by layering multiple layers of mathematical smoothing over the standard Relative Strength Index (RSI).
Core Logic Overview
The tool operates by taking raw price data and processing it through several distinct stages to filter out "market noise" and highlight significant trends. Instead of simply reacting to the immediate price change, it looks at the underlying momentum using a multi-step calculation:
1. Primary Smoothing (Moving Average) The logic begins by calculating a Moving Average of the price. This acts as a foundation, ensuring that the subsequent calculations are based on a stabilized trend rather than erratic, minute-to-minute price fluctuations.
2. Momentum Analysis (RSI Calculation) Once the smoothed price is established, the script calculates the Relative Strength Index (RSI) based on that smoothed data. This tells the user how quickly the price is moving up or down relative to its recent history.
3. Secondary Smoothing & Trend Detection To provide even greater clarity, the indicator applies a second layer of smoothing (an MA of the RSI). This creates a "trend line" for momentum, helping traders see whether the strength of a move is accelerating, decelerating, or staying constant.
Visual Signals and Alerts
The script translates these complex calculations into several visual cues on your chart:
- Trend Zones: The indicator monitors specific thresholds (30% and 70%). If the momentum stays above or below these levels, it can signal a dominant long-term trend.
- Dynamic Histograms: The tool uses a series of "Buy" and "Sell" triggers that appear as visual histograms. These are triggered by two main conditions:
- Overextended Markets: When the momentum hits extreme highs (above 80) or lows (below 20), the script looks for "rejection" signals—identifying moments where the price begins to pull back from these extremes.
- Momentum Crosses: It identifies specific points where the momentum crosses key levels (like the 50% midline), providing a visual cue of shifting strength from one direction to another.
Summary for the Trader
Essentially, this script acts as a sophisticated "momentum filter." By smoothing the data twice before displaying it, it aims to ignore minor price hiccups and focus on the actual direction of the market. It provides a combination of steady trend lines and dynamic visual signals that alert you when momentum is reaching exhausted levels or shifting its primary direction.
/*
   This indicator was created by Kalenzo
   email: bartlomiej.gorski@gmail.com
   web: http://www.fxservice.eu

   The base for this indicator was orginal RSI attached with Metatrader.
                                   ^^^^^ removed ^^^^^ :)|-<
*/
#property copyright "Copyright © 2007, MetaQuotes Software Corp."
#property link      "http://www.metaquotes.net/"

#property indicator_separate_window
#property indicator_minimum -20
#property indicator_maximum 110
#property indicator_level1 100
#property indicator_buffers 6
#property indicator_color1 Blue
#property indicator_color2 Red
#property indicator_color3 Green
#property indicator_color4 Magenta
#property indicator_color5 DodgerBlue
#property indicator_color6 BlueViolet
#property indicator_width1 2
#property indicator_width4 2
#property indicator_width5 2
//#property indicator_level1 80
//#property indicator_level2 70
#property indicator_level2 50
//#property indicator_level3 30
//#property indicator_level2 20
//---- input parameters
extern int RSIOMA          = 14;
extern int RSIOMA_MODE     = MODE_EMA;
extern int RSIOMA_PRICE    = PRICE_CLOSE;

extern int Ma_RSIOMA       = 21,
           Ma_RSIOMA_MODE  = MODE_EMA;

extern double BuyTrigger      = 80.00;
extern double SellTrigger     = 20.00;

extern color BuyTriggerColor  = DodgerBlue;
extern color SellTriggerColor = Magenta;

extern double MainTrendLong   = 30.00;
extern double MainTrendShort  = 70.00;

extern color MainTrendLongColor     = Red;
extern color MainTrendShortColor    = Green;

//---- buffers
double RSIBuffer[];
double MABuffer1[];

double bdn[],bup[];
double sdn[],sup[];

double marsioma[];
string short_name;
//+------------------------------------------------------------------+
//| Custom indicator initialization function                         |
//+------------------------------------------------------------------+
int init()
  {
   short_name = StringConcatenate("RSIOMA(",RSIOMA,")");
   IndicatorBuffers(7);

   SetIndexBuffer(0,RSIBuffer);
   SetIndexBuffer(2,bup);
   SetIndexBuffer(1,bdn);
   SetIndexBuffer(3,sdn);
   SetIndexBuffer(4,sup);
   SetIndexBuffer(5,marsioma);

   SetIndexStyle(0,DRAW_LINE);
   SetIndexStyle(2,DRAW_HISTOGRAM);
   SetIndexStyle(1,DRAW_HISTOGRAM);
   SetIndexStyle(3,DRAW_HISTOGRAM);
   SetIndexStyle(4,DRAW_HISTOGRAM);
   SetIndexStyle(5,DRAW_LINE);

   SetIndexBuffer(6,MABuffer1);

   IndicatorShortName(short_name);

   SetIndexDrawBegin(0,RSIOMA);
   SetIndexDrawBegin(1,RSIOMA);
   SetIndexDrawBegin(2,RSIOMA);
   SetIndexDrawBegin(3,RSIOMA);
   SetIndexDrawBegin(4,RSIOMA);
   SetIndexDrawBegin(5,RSIOMA);
   SetIndexDrawBegin(6,RSIOMA);
   SetIndexDrawBegin(7,RSIOMA);
//----

   drawLine(BuyTrigger,"BuyTrigger", BuyTriggerColor);
   drawLine(SellTrigger,"SellTrigger", SellTriggerColor );
   drawLine(MainTrendLong,"MainTrendLong", MainTrendLongColor );
   drawLine(MainTrendShort,"MainTrendShort",MainTrendShortColor );

   return(0);
  }
//+------------------------------------------------------------------+
//| Relative Strength Index                                          |
//+------------------------------------------------------------------+
int start()
  {
   int   i, ii;
   int   counted_bars=IndicatorCounted();
   double rel,negative,positive;
//----
   if(Bars<=RSIOMA) return(0);
//---- initial zero
   if(counted_bars<1)
      for(i=1;i<=RSIOMA;i++) {RSIBuffer[Bars-i]=0.0;}
//----
   ii=Bars-RSIOMA-1;
   if(counted_bars>=RSIOMA) ii=Bars-counted_bars-1;
   i = ii;
   while(i>=0)
      {  MABuffer1[i]=iMA(Symbol(),0,RSIOMA,0,RSIOMA_MODE,RSIOMA_PRICE,i);
      i--;  }
   i=ii;
   while(i>=0)
      {  RSIBuffer[i]=iRSIOnArray(MABuffer1,0,RSIOMA,i);
      if(RSIBuffer[i] > MainTrendLong)                   bup[i] = 12;
      if(RSIBuffer[i] < MainTrendShort)                  bdn[i] = -12;
      if(RSIBuffer[i]<20 && RSIBuffer[i]>RSIBuffer[i+1]) sup[i] = -5;
      if(RSIBuffer[i]>80 && RSIBuffer[i]<RSIBuffer[i+1]) sdn[i] = 5;
      if(RSIBuffer[i]>50)          bup[i] = 5;
      if(RSIBuffer[i]<50)          bdn[i] = -5;
      if(RSIBuffer[i]>20 && RSIBuffer[i+1]<=20)    sup[i] = 10;
      if(RSIBuffer[i+1]>=80 && RSIBuffer[i]<80)    sdn[i] = -10;


      i--;  }
   i=ii;
   while(i>=0)
      {  marsioma[i] = iMAOnArray(RSIBuffer,0,Ma_RSIOMA,0,Ma_RSIOMA_MODE,i);
      i--;}
//----
return(0);
}
//+------------------------------------------------------------------+
void drawLine(double lvl,string name, color Col )
{
            ObjectDelete(name);
            ObjectCreate(name, OBJ_HLINE, WindowFind(short_name), Time[0], lvl,Time[0], lvl);
            ObjectSet(name, OBJPROP_STYLE, STYLE_DOT);
            ObjectSet(name, OBJPROP_COLOR, Col);
            ObjectSet(name,OBJPROP_WIDTH,1);
}
Comments