RSIOMA_v2HHLSX_001
Download script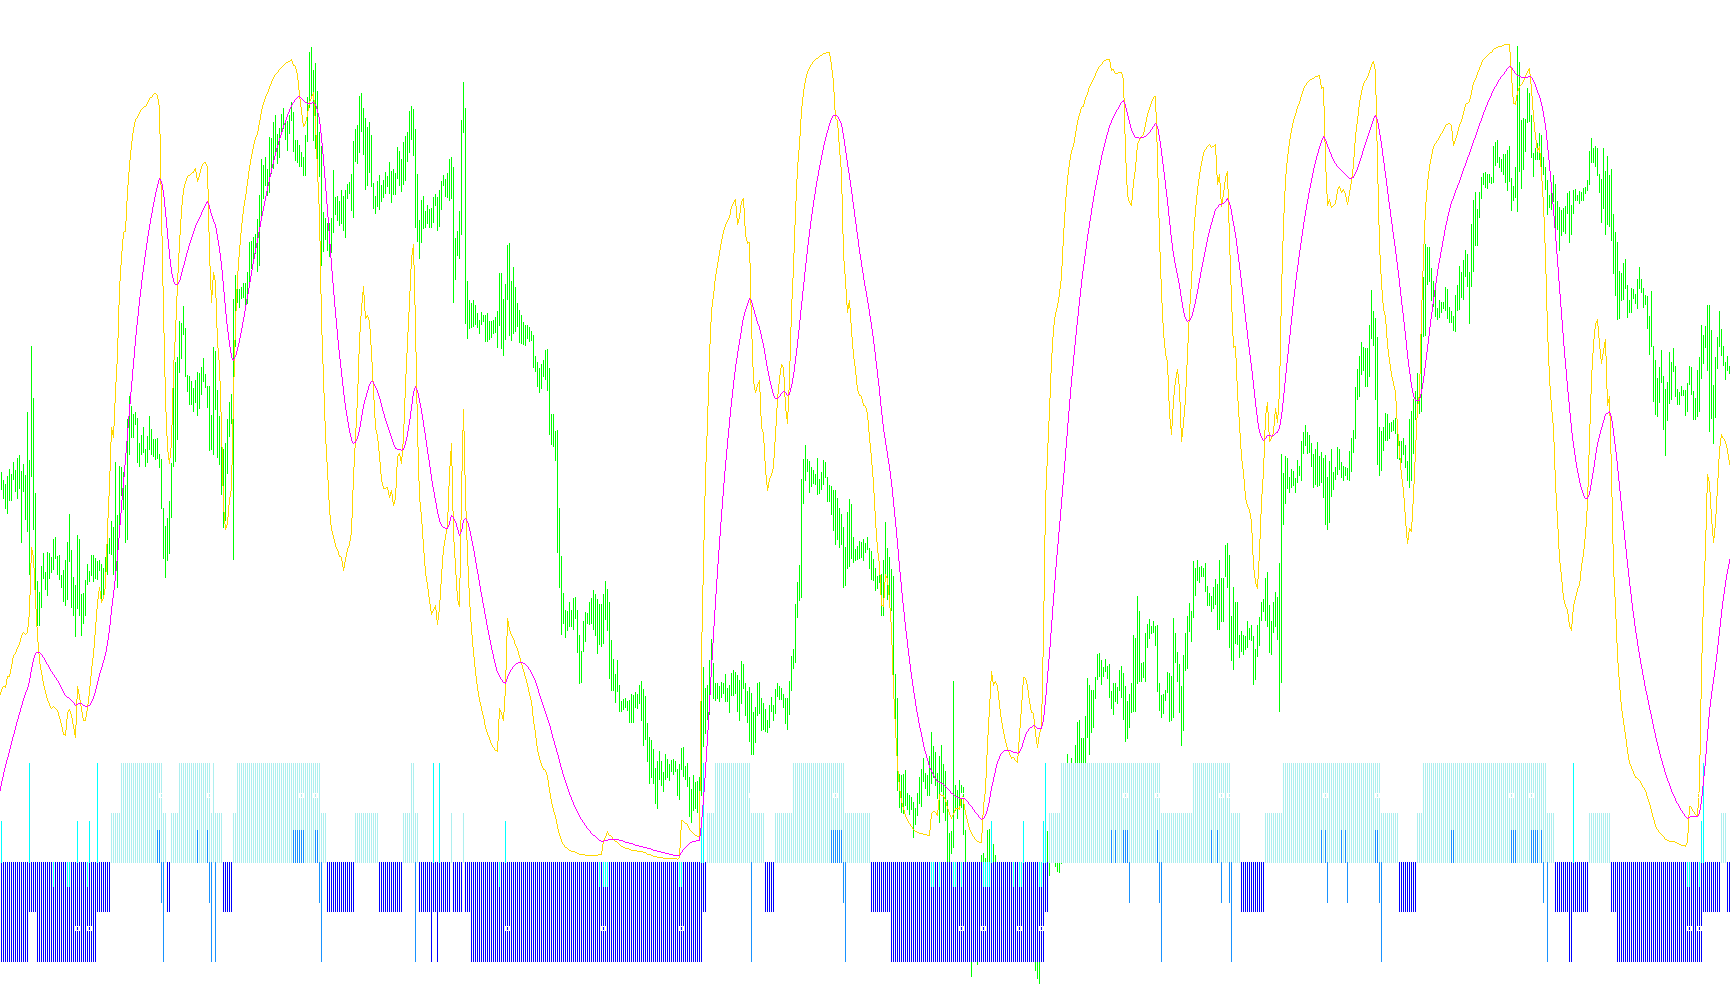
This indicator is designed to provide a multi-layered analysis of market momentum by combining traditional Relative Strength Index (RSI) logic with Moving Average smoothing. It transforms the standard RSI into a more fluid and reactive tool that helps identify trends, overextended price action, and specific entry/exit signals.
Core Logic & Data Processing
The indicator does not look at raw price alone; instead, it processes data through several stages:
- Smoothing: It first applies a Moving Average to the price data to create a stabilized base.
- Momentum Calculation: It then calculates the RSI based on that smoothed average rather than the standard price. This results in a "Smoothed RSI" (Rsioma), which reduces market noise and helps identify more reliable trends.
- Secondary Smoothing: A second layer of moving averages is applied to the RSI itself to create a secondary trend line, allowing for crossover signals.
Visual Components & Trading Signals
The indicator populates the chart window with several distinct visual cues:
-
Trend Identification (Histograms):
- The script monitors whether the smoothed RSI is above or below the 50-level midline.
- It uses specific "Main Trend" levels (30 and 70) to highlight stronger momentum. When the indicator moves into these zones, it changes the histogram intensity to signal significant upward or downward pressure.
-
Overbought & Oversold Detection:
- The logic tracks when the RSI enters extreme zones (specifically above 80 or below 20).
- It looks for "rejection" points—instances where the price momentum begins to curve back from these extremes. These are represented visually as different types of bars/histograms that signal a potential exhaustion of the current move.
-
Crossover Signals (Arrows):
- The script monitors the relationship between the Smoothed RSI and its own Moving Average.
- When the RSI crosses above its average, it generates an upward signal (represented by an arrow).
- When the RSI crosses below its average, it generates a downward signal (represented by an arrow).
Key Visual Levels
To assist the user in interpreting the data, the indicator automatically draws several horizontal reference lines:
- Trigger Levels: Specific lines at 20 and 80 to mark extreme volatility zones.
- Trend Levels: Lines at 30 and 70 to define the boundaries of the main market trend.
- Midline: A central reference point (50) used to distinguish between bullish and bearish bias.
In summary, this tool is designed for traders who want to see not just "where the price is," but "how fast it is moving" and "when that speed is likely to change," using a combination of smoothed momentum, trend boundaries, and visual crossover alerts.
//+--------------------------------------------------------------------------------+
//|      RSIOMAv2HHLSX                                 Kalenzo    fxtsd.com        |
//|  Hornet(i-RSI)                   2007, FxTSD.com;  MetaQuotes Software Corp. ik|
//|  Hist & Levels 20/80;30/70 CrossSig            web: http://www.fxservice.eu    |
//|  Rsioma/MaRsioma X sig                     email: bartlomiej.gorski@gmail.com  |
//+--------------------------------------------------------------------------------+
//  The base for this indicator was orginal RSI attached with Metatrader.
//                                      ^^ removed ^^ :)|-<   Hornet

#property copyright "Copyright © 2007, MetaQuotes Software Corp."
#property link      "http://www.metaquotes.net/"

#property indicator_separate_window
#property indicator_minimum -20
#property indicator_maximum 120
#property indicator_buffers 7
#property indicator_color1 Blue
#property indicator_color2 Red
#property indicator_color3 Green
#property indicator_color4 Magenta
#property indicator_color5 DodgerBlue
#property indicator_color6 BlueViolet
#property indicator_color7 SlateBlue //RoyalBlue
//#property indicator_color8 MediumSlateBlue
#property indicator_width1 2
#property indicator_width4 2
#property indicator_width5 2
#property indicator_width7 1
#property indicator_level1 100
#property indicator_level2 80
//#property indicator_level3 70
#property indicator_level4 50
//#property indicator_level5 30
#property indicator_level6 20
#property indicator_level7 0
#property indicator_levelcolor  SlateGray
//---- input parameters
extern int RSIOMA          = 14;
extern int RSIOMA_MODE     = MODE_EMA;
extern int RSIOMA_PRICE    = PRICE_CLOSE;

extern int Ma_RSIOMA       = 21,
           Ma_RSIOMA_MODE  = MODE_EMA;

extern double BuyTrigger      = 80.00;
extern double SellTrigger     = 20.00;

extern color BuyTriggerColor  = DodgerBlue;
extern color SellTriggerColor = Magenta;

extern double MainTrendLong   = 70.00;
extern double MainTrendShort  = 30.00;

extern color MainTrendLongColor     = Red;
extern color MainTrendShortColor    = Green;
extern double MajorTrend   = 50;

extern color marsiomaXSigColor   = SlateBlue;
//extern color marsiomaXdnSigColor   = MediumSlateBlue;

//---- buffers
double RSIBuffer[];
double MABuffer1[];

double bdn[],bup[];
double sdn[],sup[];

double marsioma[];
double marsiomaXSig[];
//double marsiomaXdnSig[];


string short_name;
//+------------------------------------------------------------------+
//| Custom indicator initialization function                         |
//+------------------------------------------------------------------+
int init()
  {
   short_name = StringConcatenate("RSIOMA(",RSIOMA,")");
 IndicatorBuffers(8);

   SetIndexBuffer(0,RSIBuffer);
   SetIndexBuffer(2,bup);
   SetIndexBuffer(1,bdn);
   SetIndexBuffer(3,sdn);//Magnet
   SetIndexBuffer(4,sup);//DodgerBlue
   SetIndexBuffer(5,marsioma);
   SetIndexBuffer(6,marsiomaXSig);
 //  SetIndexBuffer(7,marsiomaXdnSig);

  SetIndexBuffer(7,MABuffer1);

   SetIndexStyle(0,DRAW_LINE);
   SetIndexStyle(2,DRAW_HISTOGRAM);
   SetIndexStyle(1,DRAW_HISTOGRAM);
   SetIndexStyle(3,DRAW_HISTOGRAM);
   SetIndexStyle(4,DRAW_HISTOGRAM);
   SetIndexStyle(5,DRAW_LINE);
   SetIndexStyle(6,DRAW_ARROW);
 //  SetIndexStyle(7,DRAW_ARROW);
   SetIndexArrow(6,250);//85,88,251(x),252';108,158,159(dot);161,162(crcl);110,167(sq);176-179('scope');11-113,250(hlwSq)
 //  SetIndexArrow(7,159);
 //  SetIndexEmptyValue(6,EMPTY_VALUE);
 //   SetIndexEmptyValue(7,EMPTY_VALUE);
    SetIndexLabel(0,"Rsioma");
    SetIndexLabel(5,"MaRsioma");
     SetIndexLabel(1,"TrendDn");
     SetIndexLabel(2,"TrendUp");
     SetIndexLabel(6,"Up/DnXsig");

   IndicatorShortName(short_name);

   SetIndexDrawBegin(0,RSIOMA);
   SetIndexDrawBegin(1,RSIOMA);
   SetIndexDrawBegin(2,RSIOMA);
   SetIndexDrawBegin(3,RSIOMA);
   SetIndexDrawBegin(4,RSIOMA);
   SetIndexDrawBegin(5,RSIOMA);
   SetIndexDrawBegin(6,RSIOMA);
   SetIndexDrawBegin(7,RSIOMA);
//----

   drawLine(BuyTrigger,"BuyTrigger", BuyTriggerColor);
   drawLine(SellTrigger,"SellTrigger", SellTriggerColor );
   drawLine(MainTrendLong,"MainTrendLong", MainTrendLongColor );
   drawLine(MainTrendShort,"MainTrendShort",MainTrendShortColor );

   return(0);
  }
//+------------------------------------------------------------------+
//| Relative Strength Index                                          |
//+------------------------------------------------------------------+
int start()
  {
   int   i, ii;
   int   counted_bars=IndicatorCounted();
   double rel,negative,positive;
//----
   if(Bars<=RSIOMA) return(0);
//---- initial zero
   if(counted_bars<1)
      for(i=1;i<=RSIOMA;i++) {RSIBuffer[Bars-i]=0.0;}
//----
   ii=Bars-RSIOMA-1;
   if(counted_bars>=RSIOMA) ii=Bars-counted_bars-1;
   i = ii;
   while(i>=0)
      {  MABuffer1[i]=iMA(Symbol(),0,RSIOMA,0,RSIOMA_MODE,RSIOMA_PRICE,i);
      i--;  }
   i=ii;
   while(i>=0)
      {  RSIBuffer[i]=iRSIOnArray(MABuffer1,0,RSIOMA,i);
      if(RSIBuffer[i]>50)          bup[i] = 6;
      if(RSIBuffer[i]<50)          bdn[i] = -6;
      if(RSIBuffer[i] > MainTrendLong)                   bup[i] = 12;
      if(RSIBuffer[i] < MainTrendShort)                  bdn[i] = -12;

      if(RSIBuffer[i]<20 && RSIBuffer[i]>RSIBuffer[i+1]) sup[i] = -3;
      if(RSIBuffer[i]>80 && RSIBuffer[i]<RSIBuffer[i+1]) sdn[i] = 4;
      if(RSIBuffer[i]>20 && RSIBuffer[i+1]<=20)    sup[i] = 5;
      if(RSIBuffer[i+1]>=80 && RSIBuffer[i]<80)    sdn[i] = -5;
  if(RSIBuffer[i+1]<=MainTrendShort && RSIBuffer[i]>MainTrendShort)  sup[i] = 12;
  if(RSIBuffer[i]<MainTrendLong && RSIBuffer[i+1]>=MainTrendLong)   sdn[i] = -12;
   i--;  }
   i=ii;
   while(i>=0)
      {  marsioma[i] = iMAOnArray(RSIBuffer,0,Ma_RSIOMA,0,Ma_RSIOMA_MODE,i);
 marsiomaXSig[i] = EMPTY_VALUE;
 //marsiomaXdnSig[i] = EMPTY_VALUE;
 if(RSIBuffer[i+1]<=marsioma[i+1]&&RSIBuffer[i]>marsioma[i]) marsiomaXSig[i] = -8;
 if(RSIBuffer[i+1]>=marsioma[i+1]&&RSIBuffer[i]<marsioma[i]) marsiomaXSig[i] = 8;
      i--;}
//----
return(0);
}
//+------------------------------------------------------------------+
void drawLine(double lvl,string name, color Col )
{
            ObjectDelete(name);
            ObjectCreate(name, OBJ_HLINE, WindowFind(short_name), Time[0], lvl,Time[0], lvl);
            ObjectSet(name, OBJPROP_STYLE, STYLE_DOT);
            ObjectSet(name, OBJPROP_COLOR, Col);
            ObjectSet(name,OBJPROP_WIDTH,1);
}
Comments