RSIOMA_v2_v1
Download script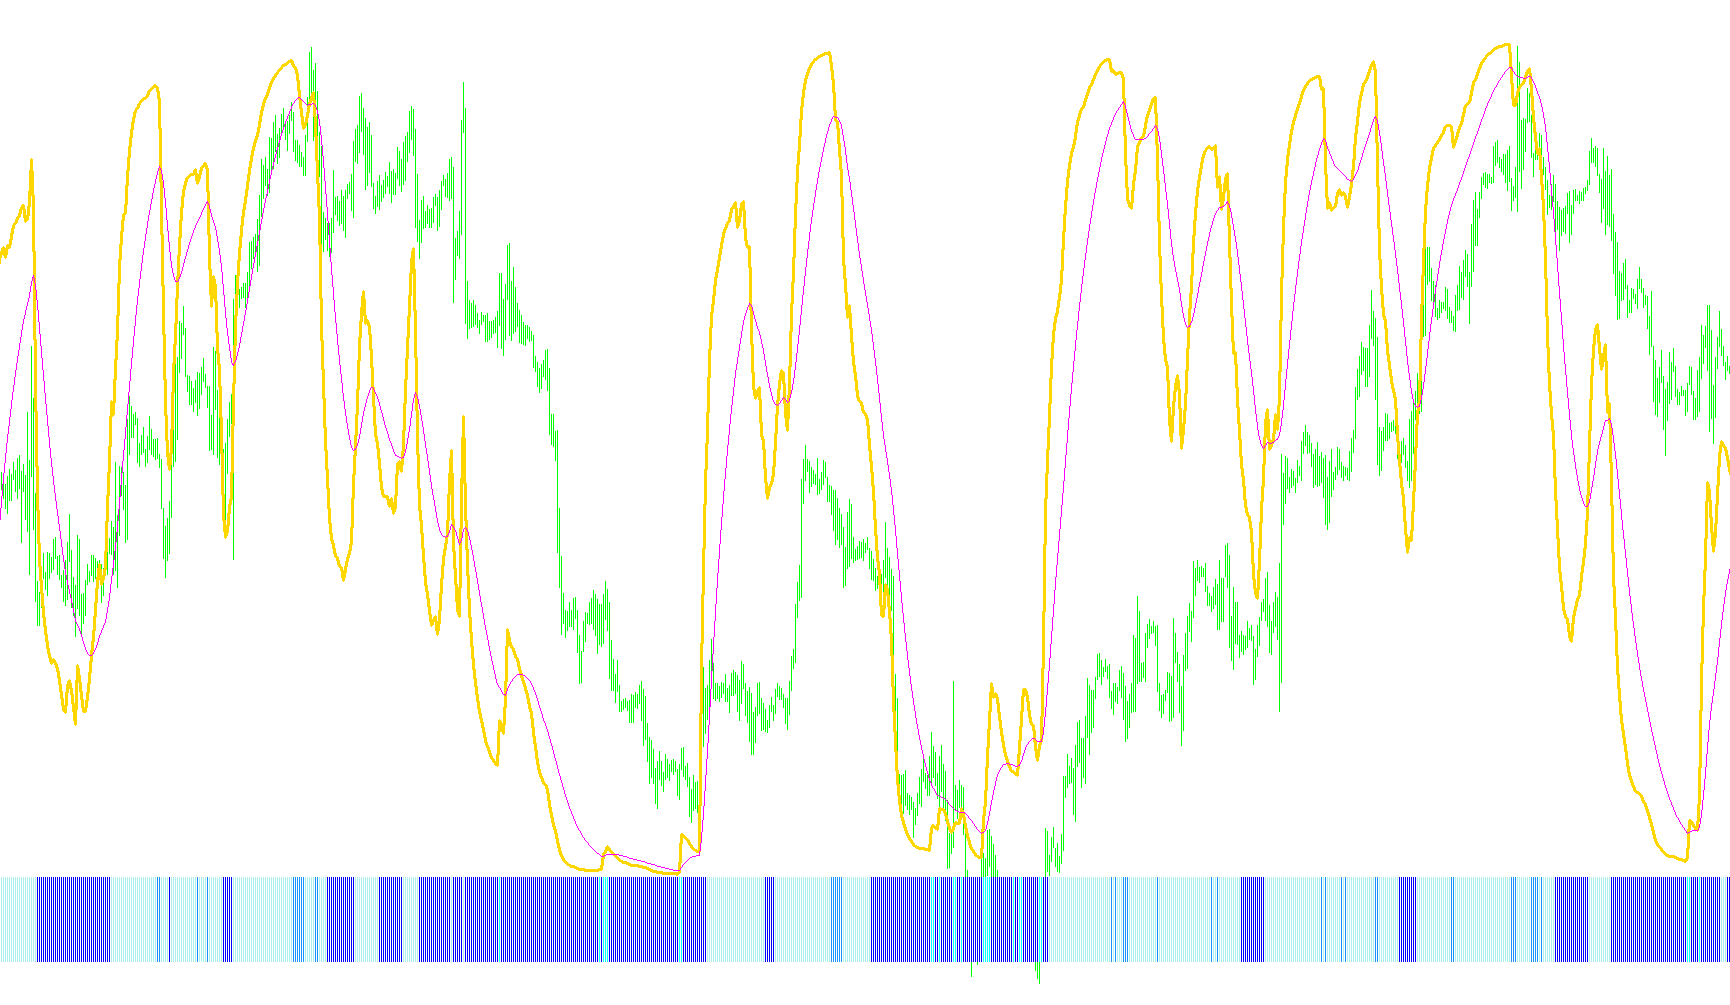
This indicator is a sophisticated evolution of the standard Relative Strength Index (RSI), designed to provide traders with a clearer picture of market momentum and potential reversal points. While a standard RSI shows the speed and change of price movements, this tool adds layers of smoothing and visual signals to help filter out "market noise" and identify high-probability trends.
Core Logic and Components
1. Advanced Smoothing Mechanism Unlike basic oscillators that can be erratic, this script employs a dual-smoothing approach. It calculates momentum based on moving averages rather than raw price data, then applies an exponential smoothing formula to the results. This ensures that the resulting lines are fluid and less prone to sudden, jagged spikes that often trigger false signals in standard technical analysis.
2. Trend Identification The tool establishes a "neutral zone" centered around the 50-level mark. It uses specific visual markers to distinguish between different market environments:
- Long Trends: When the indicator moves above the upper threshold (50), it signifies bullish momentum.
- Short Trends: When the indicator drops below the lower threshold (50), it indicates bearish momentum.
3. Overbought and Oversold Signals The script features dedicated logic to identify extreme market conditions. It looks for two specific behaviors:
- Support Signals: When the indicator enters the "oversold" territory (below 20) and begins to turn upward, it marks a potential buying opportunity.
- Supply/Resistance Signals: When the indicator reaches "overbought" levels (above 80) and starts to curve downward, it highlights a potential selling opportunity.
4. Visual Dashboard To make these calculations actionable for the user, the indicator translates data into clear visual cues:
- Trend Lines: A primary smoothed RSI line helps track the overall direction of the market.
- Moving Average Overlay: An additional moving average is calculated specifically on top of the RSI data, providing a second layer of confirmation for trend strength.
- Dynamic Color Coding: The script uses distinct colors (such as DodgerBlue and Magenta) to draw horizontal reference lines, clearly defining the boundaries for entries and exits.
Summary for the Trader
By combining smoothed momentum with specific "trigger" zones, this tool helps you stay on the right side of the trend. It is designed to tell you not just if the market is moving, but whether that movement is becoming exhausted (overbought/oversold) or if it has enough strength to continue its current path.
/*
   This indicator was created by Kalenzo
   email: bartlomiej.gorski@gmail.com
   web: http://www.fxservice.eu

   The base for this indicator was orginal RSI attached with Metatrader.
*/
#property copyright "Copyright © 2004, MetaQuotes Software Corp."
#property link      "http://www.metaquotes.net/"

#property indicator_separate_window
#property indicator_minimum -10
#property indicator_maximum 100
#property indicator_buffers 6
#property indicator_color1 Blue
#property indicator_color2 Red
#property indicator_color3 Green
#property indicator_color4 Magenta
#property indicator_color5 DodgerBlue
#property indicator_color6 BlueViolet

//---- input parameters
extern int RSIOMA          = 14;
extern int RSIOMA_MODE     = MODE_EMA;
extern int RSIOMA_PRICE    = PRICE_CLOSE;

extern int Ma_RSIOMA       = 21,
           Ma_RSIOMA_MODE  = MODE_EMA;

extern int BuyTrigger      = 80;
extern int SellTrigger     = 20;

extern color BuyTriggerColor  = DodgerBlue;
extern color SellTriggerColor = Magenta;

extern int MainTrendLong   = 50;
extern int MainTrendShort  = 50;

extern color MainTrendLongColor     = Red;
extern color MainTrendShortColor    = Green;

//---- buffers
double RSIBuffer[];
double PosBuffer[];
double NegBuffer[];

double bdn[],bup[];
double sdn[],sup[];

double marsioma[];
string short_name;
//+------------------------------------------------------------------+
//| Custom indicator initialization function                         |
//+------------------------------------------------------------------+
int init()
  {
   short_name = StringConcatenate("RSIOMA(",RSIOMA,")");
   IndicatorBuffers(8);

   SetIndexBuffer(0,RSIBuffer);
   SetIndexBuffer(2,bup);
   SetIndexBuffer(1,bdn);
   SetIndexBuffer(3,sdn);
   SetIndexBuffer(4,sup);
   SetIndexBuffer(5,marsioma);

   SetIndexStyle(0,DRAW_LINE,STYLE_SOLID,3);
   SetIndexStyle(2,DRAW_HISTOGRAM,STYLE_SOLID,1);
   SetIndexStyle(1,DRAW_HISTOGRAM,STYLE_SOLID,1);
   SetIndexStyle(3,DRAW_HISTOGRAM,STYLE_SOLID,1);
   SetIndexStyle(4,DRAW_HISTOGRAM,STYLE_SOLID,1);
   SetIndexStyle(5,DRAW_LINE,STYLE_SOLID,1);

   SetIndexBuffer(6,PosBuffer);
   SetIndexBuffer(7,NegBuffer);

   IndicatorShortName(short_name);

   SetIndexDrawBegin(0,RSIOMA);
   SetIndexDrawBegin(1,RSIOMA);
   SetIndexDrawBegin(2,RSIOMA);
   SetIndexDrawBegin(3,RSIOMA);
   SetIndexDrawBegin(4,RSIOMA);
   SetIndexDrawBegin(5,RSIOMA);
   SetIndexDrawBegin(6,RSIOMA);
   SetIndexDrawBegin(7,RSIOMA);
//----

   drawLine(BuyTrigger,"BuyTrigger", BuyTriggerColor);
   drawLine(SellTrigger,"SellTrigger", SellTriggerColor );
   drawLine(MainTrendLong,"MainTrendLong", MainTrendLongColor );
   drawLine(MainTrendShort,"MainTrendShort",MainTrendShortColor );

   return(0);
  }
//+------------------------------------------------------------------+
//| Relative Strength Index                                          |
//+------------------------------------------------------------------+
int start()
  {


   int    i,counted_bars=IndicatorCounted();
   double rel,negative,positive;
//----
   if(Bars<=RSIOMA) return(0);
//---- initial zero
   if(counted_bars<1)
      for(i=1;i<=RSIOMA;i++) RSIBuffer[Bars-i]=0.0;
//----
   i=Bars-RSIOMA-1;
   int ma = i;
   if(counted_bars>=RSIOMA) i=Bars-counted_bars-1;
   while(i>=0)
     {
      double sumn=0.0,sump=0.0;
      if(i==Bars-RSIOMA-1)
        {
         int k=Bars-2;
         //---- initial accumulation
         while(k>=i)
           {

            double cma = iMA(Symbol(),0,RSIOMA,0,RSIOMA_MODE,RSIOMA_PRICE,k);
            double pma = iMA(Symbol(),0,RSIOMA,0,RSIOMA_MODE,RSIOMA_PRICE,k+1);

            rel=cma-pma;

            if(rel>0) sump+=rel;
            else      sumn-=rel;
            k--;
           }
         positive=sump/RSIOMA;
         negative=sumn/RSIOMA;
        }
      else
        {
         //---- smoothed moving average
         double ccma = iMA(Symbol(),0,RSIOMA,0,RSIOMA_MODE,RSIOMA_PRICE,i);
         double ppma = iMA(Symbol(),0,RSIOMA,0,RSIOMA_MODE,RSIOMA_PRICE,i+1);

         rel=ccma-ppma;

         if(rel>0) sump=rel;
         else      sumn=-rel;
         positive=(PosBuffer[i+1]*(RSIOMA-1)+sump)/RSIOMA;
         negative=(NegBuffer[i+1]*(RSIOMA-1)+sumn)/RSIOMA;
        }
      PosBuffer[i]=positive;
      NegBuffer[i]=negative;
      if(negative==0.0) RSIBuffer[i]=0.0;
      else
      {
          RSIBuffer[i]=100.0-100.0/(1+positive/negative);

          bdn[i] = 0;
          bup[i] = 0;
          sdn[i] = 0;
          sup[i] = 0;

          if(RSIBuffer[i]>MainTrendLong)
          bup[i] = -10;

          if(RSIBuffer[i]<MainTrendShort)
          bdn[i] = -10;

          if(RSIBuffer[i]<20 && RSIBuffer[i]>RSIBuffer[i+1])
          sup[i] = -10;

          if(RSIBuffer[i]>80 && RSIBuffer[i]<RSIBuffer[i+1])
          sdn[i] = -10;


      }
      i--;
     }

     while(ma>=0)
     {
         marsioma[ma] = iMAOnArray(RSIBuffer,0,Ma_RSIOMA,0,Ma_RSIOMA_MODE,ma);
         ma--;
     }

//----
   return(0);
  }
//+------------------------------------------------------------------+
void drawLine(double lvl,string name, color Col )
{

            ObjectDelete(name);
            ObjectCreate(name, OBJ_HLINE, WindowFind(short_name), Time[0], lvl,Time[0],lvl);


            ObjectSet(name, OBJPROP_STYLE, STYLE_DOT);

            ObjectSet(name, OBJPROP_COLOR, Col);
            ObjectSet(name,OBJPROP_WIDTH,1);


}
Comments