RSIOMA_v2HHLS22
Download script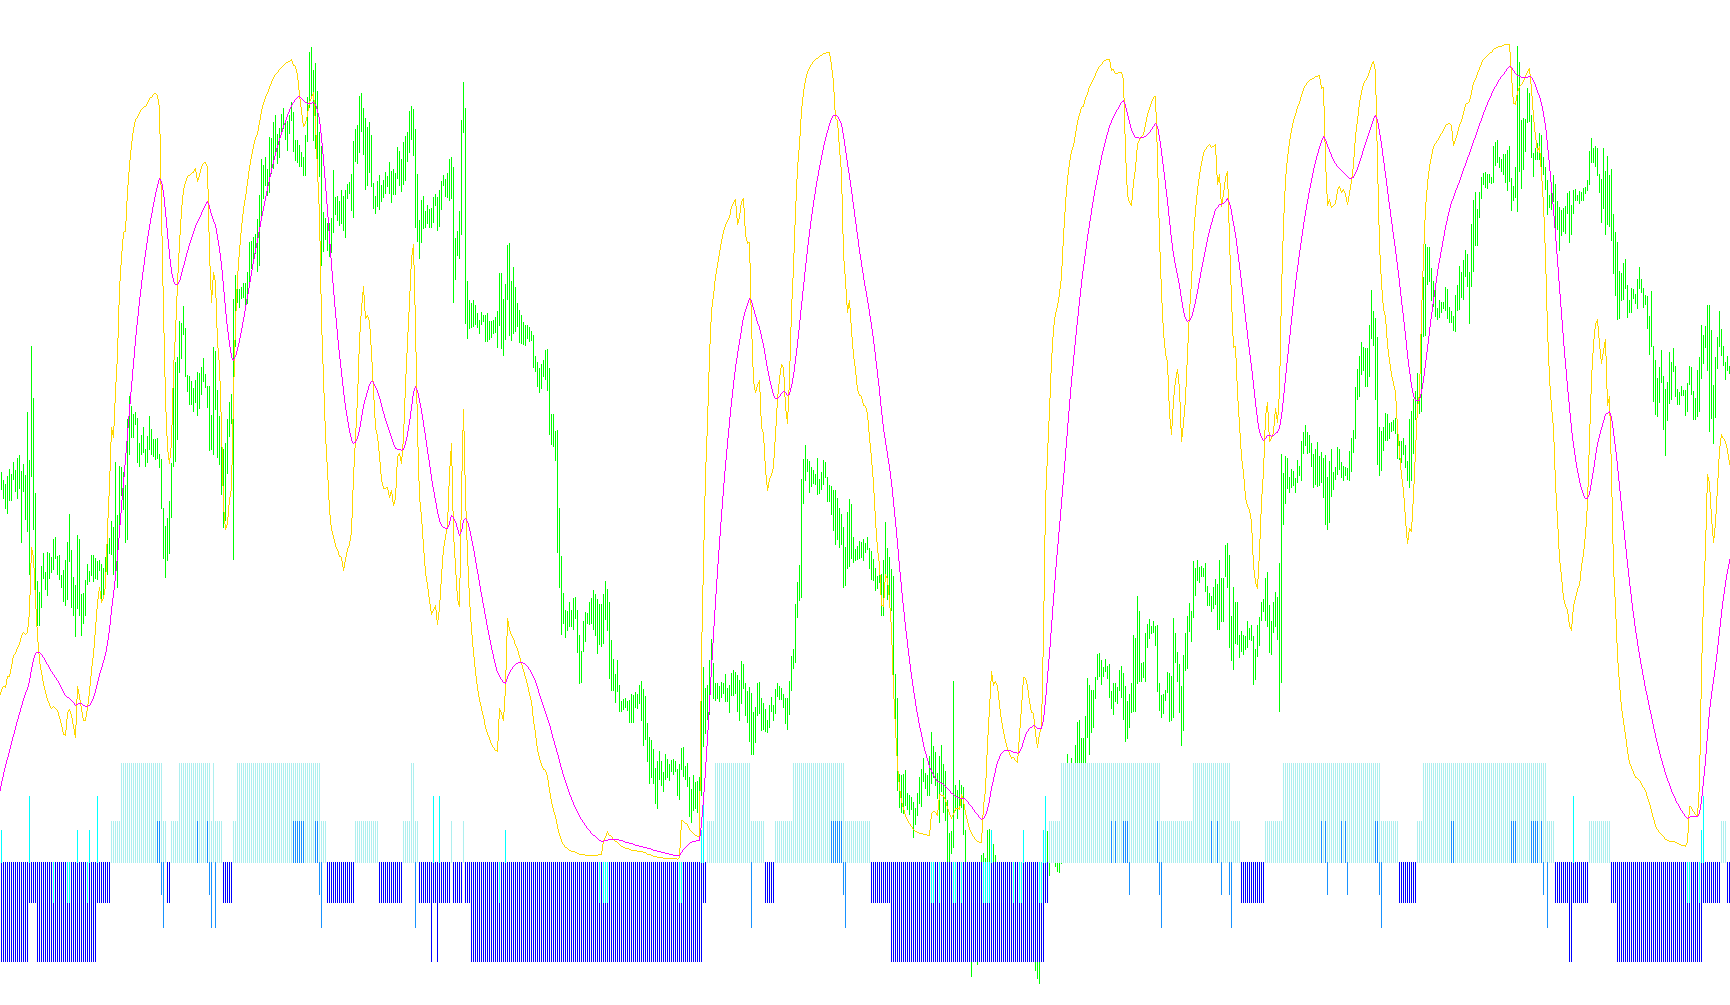
This script is a sophisticated technical analysis tool designed to help traders visualize market momentum, trend direction, and potential entry or exit points by combining several classic trading indicators into a single, cohesive display.
Core Logic Overview
Instead of relying on a standard Relative Strength Index (RSI), which can sometimes be "noisy" or provide false signals, this tool applies a secondary layer of smoothing. It takes the price data and processes it through a Moving Average first, then calculates the RSI based on that smoothed average. This results in a much cleaner, more stable visual representation of market strength.
Key Visual Components
The indicator provides four distinct types of information simultaneously:
1. Momentum & Trend Smoothing The primary line on the chart represents the core momentum of the asset. To provide even deeper clarity, the script calculates a secondary "Moving Average of the RSI." This helps traders identify the broader direction of the market, filtering out minor fluctuations to show whether the overarching trend is tilting upward or downward.
2. Dynamic Trend Signaling (Histograms) The tool uses colored histograms (bars) to provide immediate visual cues regarding the current market environment:
- Bullish Sentiment: When momentum moves above the midpoint (50), the histogram provides positive signals. If it pushes further into "Long" territory, the intensity of these signals increases.
- Bearish Sentiment: Conversely, when momentum falls below the midpoint, the histogram reflects negative sentiment, with increased intensity as it reaches "Short" territory.
3. Overbought and Oversold Detection The script actively monitors for "extreme" conditions where prices might be stretched too far in one direction:
- Support Signals: It identifies areas where the market is technically oversold (falling below specific low thresholds). If the momentum begins to turn back upward from these lows, it highlights potential support.
- Resistance Signals: It identifies overbought areas (rising above high thresholds). If the momentum begins to curve downward from these peaks, it highlights potential resistance.
4. Visual Thresholds To help the trader stay oriented, the tool automatically draws static reference lines on the display:
- Buy/Sell Triggers: Specific levels that act as "alert" zones for high-probability entries.
- Main Trend Lines: Boundaries that separate standard market movement from strong, aggressive trends.
Summary of User Experience
For a trader, this means the tool does the heavy lifting of calculating multiple overlapping data points. Instead of looking at three different charts to see if a trend is healthy, the RSIOMAv2HHLS22 combines smoothed momentum, trend intensity, and overextended price warnings into one window, using distinct colors and shapes to highlight where the market is likely moving and where it might be ready to reverse.
//+--------------------------------------------------------------------------------+
//|                         RSIOMAv2HHLS22                 Kalenzo    fxtsd.com       |
//|    HistLevel/Sig mod               Copyright © 2004, MetaQuotes Software Corp. |
//|  FXtsd.com                                    web: http://www.fxservice.eu     |
//|                                           email: bartlomiej.gorski@gmail.com   |
//+--------------------------------------------------------------------------------+
//  The base for this indicator was orginal RSI attached with Metatrader.
//                                       ^^^^^ removed ^^^^^ :)|-<

#property copyright "Copyright © 2007, MetaQuotes Software Corp."
#property link      "http://www.metaquotes.net/"

#property indicator_separate_window
#property indicator_minimum -15
#property indicator_maximum 110
#property indicator_level1 100
#property indicator_buffers 6
#property indicator_color1 Blue
#property indicator_color2 Red
#property indicator_color3 Green
#property indicator_color4 Magenta
#property indicator_color5 DodgerBlue
#property indicator_color6 BlueViolet
#property indicator_width1 2
#property indicator_width4 2
#property indicator_width5 2
//#property indicator_level1 80
//#property indicator_level2 70
#property indicator_level2 50
//#property indicator_level3 30
//#property indicator_level2 20
//---- input parameters
extern int RSIOMA          = 14;
extern int RSIOMA_MODE     = MODE_EMA;
extern int RSIOMA_PRICE    = PRICE_CLOSE;

extern int Ma_RSIOMA       = 21,
           Ma_RSIOMA_MODE  = MODE_EMA;

extern double BuyTrigger      = 80.00;
extern double SellTrigger     = 20.00;

extern color BuyTriggerColor  = DodgerBlue;
extern color SellTriggerColor = Magenta;

extern double MainTrendLong   = 70.00;
extern double MainTrendShort  = 30.00;

extern color MainTrendLongColor     = Red;
extern color MainTrendShortColor    = Green;
extern double MajorTrend   = 50;
//---- buffers
double RSIBuffer[];
double MABuffer1[];

double bdn[],bup[];
double sdn[],sup[];

double marsioma[];
string short_name;
//+------------------------------------------------------------------+
//| Custom indicator initialization function                         |
//+------------------------------------------------------------------+
int init()
  {
   short_name = StringConcatenate("RSIOMA(",RSIOMA,")");
   IndicatorBuffers(7);

   SetIndexBuffer(0,RSIBuffer);
   SetIndexBuffer(2,bup);
   SetIndexBuffer(1,bdn);
   SetIndexBuffer(3,sdn);
   SetIndexBuffer(4,sup);
   SetIndexBuffer(5,marsioma);

   SetIndexStyle(0,DRAW_LINE);
   SetIndexStyle(2,DRAW_HISTOGRAM);
   SetIndexStyle(1,DRAW_HISTOGRAM);
   SetIndexStyle(3,DRAW_HISTOGRAM);
   SetIndexStyle(4,DRAW_HISTOGRAM);
   SetIndexStyle(5,DRAW_LINE);

   SetIndexBuffer(6,MABuffer1);

   IndicatorShortName(short_name);

   SetIndexDrawBegin(0,RSIOMA);
   SetIndexDrawBegin(1,RSIOMA);
   SetIndexDrawBegin(2,RSIOMA);
   SetIndexDrawBegin(3,RSIOMA);
   SetIndexDrawBegin(4,RSIOMA);
   SetIndexDrawBegin(5,RSIOMA);
   SetIndexDrawBegin(6,RSIOMA);
   SetIndexDrawBegin(7,RSIOMA);
//----

   drawLine(BuyTrigger,"BuyTrigger", BuyTriggerColor);
   drawLine(SellTrigger,"SellTrigger", SellTriggerColor );
   drawLine(MainTrendLong,"MainTrendLong", MainTrendLongColor );
   drawLine(MainTrendShort,"MainTrendShort",MainTrendShortColor );

   return(0);
  }
//+------------------------------------------------------------------+
//| Relative Strength Index                                          |
//+------------------------------------------------------------------+
int start()
  {
   int   i, ii;
   int   counted_bars=IndicatorCounted();
   double rel,negative,positive;
//----
   if(Bars<=RSIOMA) return(0);
//---- initial zero
   if(counted_bars<1)
      for(i=1;i<=RSIOMA;i++) {RSIBuffer[Bars-i]=0.0;}
//----
   ii=Bars-RSIOMA-1;
   if(counted_bars>=RSIOMA) ii=Bars-counted_bars-1;
   i = ii;
   while(i>=0)
      {  MABuffer1[i]=iMA(Symbol(),0,RSIOMA,0,RSIOMA_MODE,RSIOMA_PRICE,i);
      i--;  }
   i=ii;
   while(i>=0)
      {  RSIBuffer[i]=iRSIOnArray(MABuffer1,0,RSIOMA,i);
      if(RSIBuffer[i]>50)          bup[i] = 5;
      if(RSIBuffer[i]<50)          bdn[i] = -5;
      if(RSIBuffer[i] > MainTrendLong)                   bup[i] = 12;
      if(RSIBuffer[i] < MainTrendShort)                  bdn[i] = -12;
      if(RSIBuffer[i]<20 && RSIBuffer[i]>RSIBuffer[i+1]) sup[i] = -5;
      if(RSIBuffer[i]>80 && RSIBuffer[i]<RSIBuffer[i+1]) sdn[i] = 5;
      if(RSIBuffer[i]>20 && RSIBuffer[i+1]<=20)    sup[i] = 4;
      if(RSIBuffer[i+1]>=80 && RSIBuffer[i]<80)    sdn[i] = -4;
      if(RSIBuffer[i+1]<=MainTrendShort && RSIBuffer[i]>MainTrendShort)  sup[i] = 8;
      if(RSIBuffer[i]<MainTrendLong && RSIBuffer[i+1]>=MainTrendLong)   sdn[i] = -8;


      i--;  }
   i=ii;
   while(i>=0)
      {  marsioma[i] = iMAOnArray(RSIBuffer,0,Ma_RSIOMA,0,Ma_RSIOMA_MODE,i);
      i--;}
//----
return(0);
}
//+------------------------------------------------------------------+
void drawLine(double lvl,string name, color Col )
{
            ObjectDelete(name);
            ObjectCreate(name, OBJ_HLINE, WindowFind(short_name), Time[0], lvl,Time[0], lvl);
            ObjectSet(name, OBJPROP_STYLE, STYLE_DOT);
            ObjectSet(name, OBJPROP_COLOR, Col);
            ObjectSet(name,OBJPROP_WIDTH,1);
}
Comments