RSIOMA_v2MA_001
Download script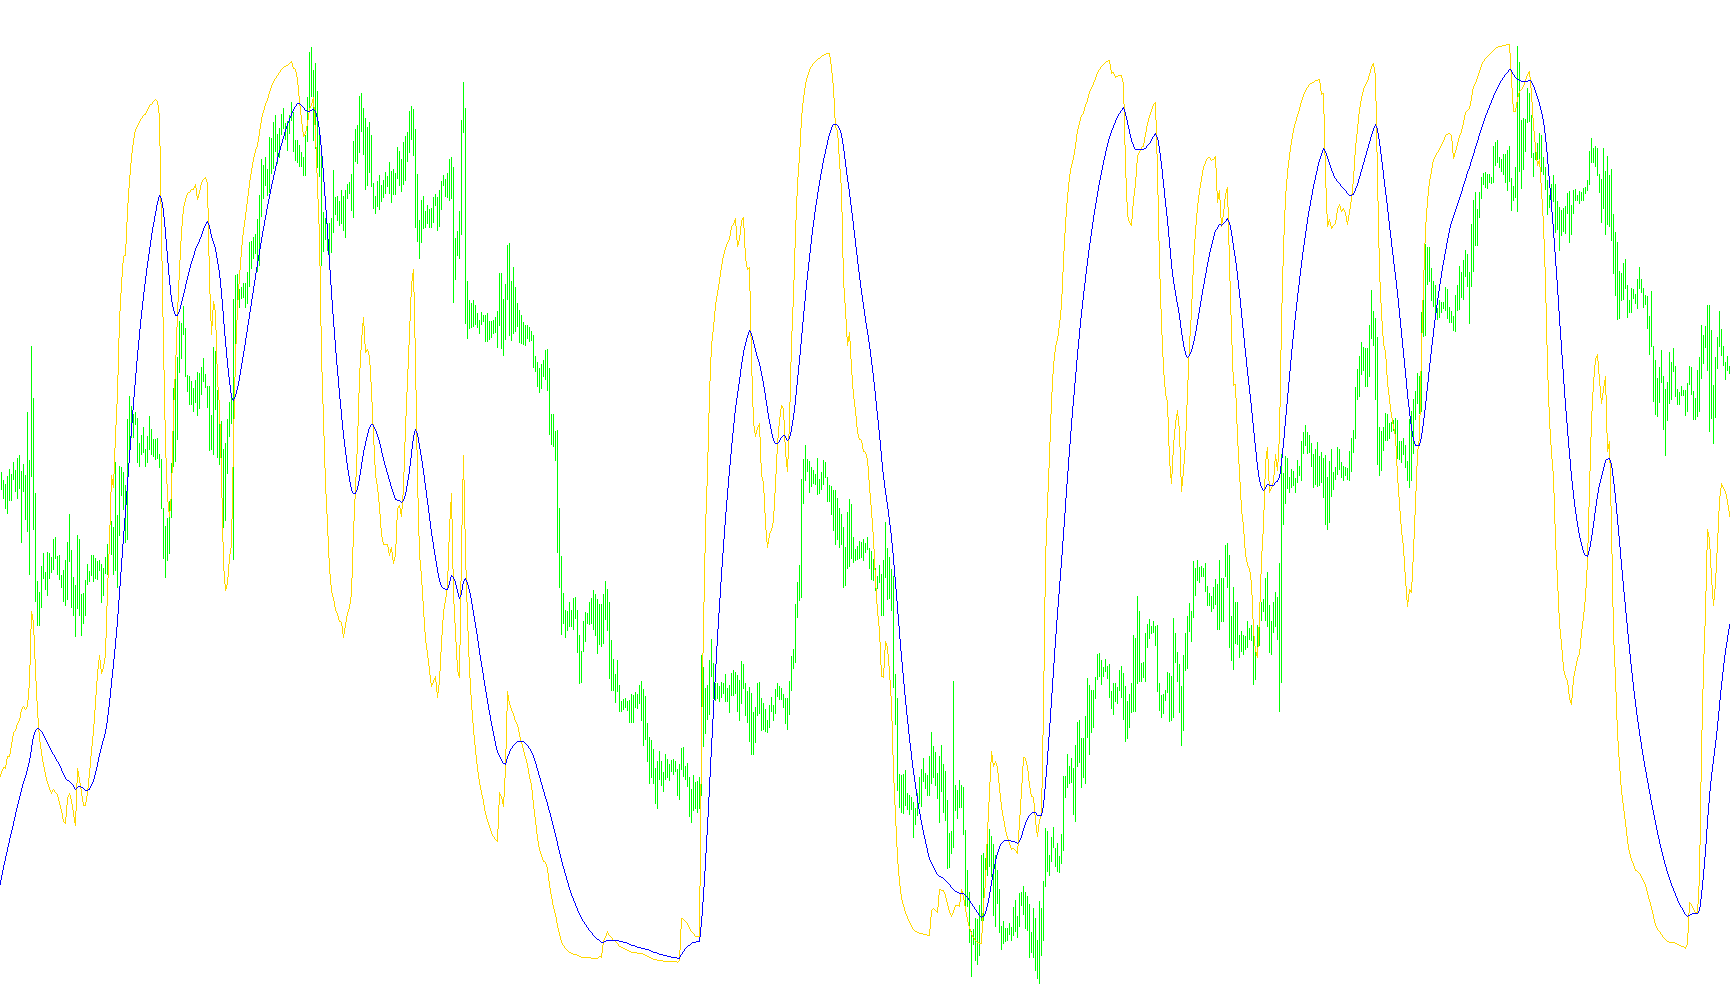
The RSIOMAv2MA(Lite) is a specialized technical analysis tool designed to provide a smoothed, more nuanced view of market momentum compared to the standard Relative Strength Index (RSI) found in most trading platforms. While the standard RSI can often be "noisy" or produce rapid fluctuations that make it difficult to identify clear trends, this script applies a multi-layered smoothing process to filter out market distractions and highlight underlying price dynamics.
How the Logic Works
The indicator functions by processing data through three distinct mathematical layers:
1. The Foundation (Moving Average Calculation) Instead of calculating momentum based on raw price action alone, the tool begins by generating a Moving Average (MA). This step stabilizes the price data, ensuring that short-term "spikes" or erratic price movements do not cause unnecessary fluctuations in the final reading.
2. The Momentum Analysis (RSI on Moving Average) The script then applies the Relative Strength Index (RSI) logic to that smoothed Moving Average rather than the raw price. By analyzing the momentum of a moving average, the indicator captures the "trend of the trend." This helps traders see whether the current price direction is gaining strength or losing steam in a more consistent manner.
3. The Final Smoothing (The Master Moving Average) To achieve its final form, the script applies one last layer of smoothing to the results of the previous step. This creates a fluid, continuous line that tracks market sentiment. It reduces "whipsaws"—those instances where an indicator flips back and forth rapidly—allowing for a clearer visual representation of whether the market is becoming overbought, oversold, or maintaining a steady trajectory.
Visual Indicators & Interpretation
The tool is designed to operate in a separate window and features several pre-defined horizontal levels (such as 80, 70, 50, 30, and 20). These serve as visual benchmarks:
- Overextended Zones: When the lines move toward the higher levels (e.g., 70 or 80), it suggests the market may be reaching an overbought state.
- Depleted Zones: Movement toward the lower levels (e.g., 20 or 30) suggests the market may be entering an oversold state.
- Trend Confirmation: The relationship between the main smoothed line and these levels helps traders identify potential reversal points or continued momentum in a specific direction.
By combining Moving Averages with RSI logic, this script provides a refined perspective that prioritizes clarity and trend reliability over raw, unrefined price data.
//+--------------------------------------------------------------------------------+
//|                         RSIOMAv2MA(Lite)             Kalenzo    fxtsd.com      |
//| Hornet(i-RSI) - HistLevel/Sig mod   Copyright © 2004, MetaQuotes Software Corp.|
//|  FXtsd.com                                    web: http://www.fxservice.eu   ik|
//|                                           email: bartlomiej.gorski@gmail.com   |
//+--------------------------------------------------------------------------------+
//  The base for this indicator was orginal RSI attached with Metatrader.
//                                       ^ removed ^ :)|-<   Hornet  buchered by fxbs

#property copyright "Copyright © 2007, MetaQuotes Software Corp."
#property link      "http://www.metaquotes.net/"

#property indicator_separate_window
#property indicator_maximum 100
#property indicator_minimum 0
#property indicator_buffers 2
#property indicator_color1 MediumBlue
#property indicator_color2 Purple
#property indicator_width1 2
#property indicator_width2 1
#property indicator_width1 2
#property indicator_level1 100
#property indicator_level2 80//76.4
#property indicator_level3 70//61.8
#property indicator_level4 50
#property indicator_level5 30//38.2
#property indicator_level6 20 //23.6
#property indicator_level7 0
#property indicator_levelcolor  SlateGray
//---- input parameters
extern int RSIOMA          = 14;
extern int RSIOMA_MODE     = MODE_EMA;
extern int RSIOMA_PRICE    = PRICE_CLOSE;

extern int Ma_RSIOMA       = 21,
           Ma_RSIOMA_MODE  = MODE_EMA;
//---- buffers
double RSIBuffer[];
double MABuffer1[];
double marsioma[];
string short_name;
//+------------------------------------------------------------------+
//| Custom indicator initialization function                         |
//+------------------------------------------------------------------+
int init()
  {
   short_name = StringConcatenate("RSIOMA(",RSIOMA,")");
   IndicatorBuffers(7);

   SetIndexBuffer(0,RSIBuffer);
   SetIndexBuffer(1,marsioma);

   SetIndexStyle(0,DRAW_LINE);
   SetIndexStyle(1,DRAW_LINE);

   SetIndexBuffer(2,MABuffer1);

   IndicatorShortName(short_name);

   SetIndexDrawBegin(0,RSIOMA);
   SetIndexDrawBegin(1,RSIOMA);
   return(0);
  }
//+------------------------------------------------------------------+
//| Relative Strength Index                                          |
//+------------------------------------------------------------------+
int start()
  {
   int   i, ii;
   int   counted_bars=IndicatorCounted();
   double rel,negative,positive;
//----
   if(Bars<=RSIOMA) return(0);
//---- initial zero
   if(counted_bars<1)
      for(i=1;i<=RSIOMA;i++) {RSIBuffer[Bars-i]=0.0;}
//----
   ii=Bars-RSIOMA-1;
   if(counted_bars>=RSIOMA) ii=Bars-counted_bars-1;
   i = ii;
   while(i>=0)
      {  MABuffer1[i]=iMA(Symbol(),0,RSIOMA,0,RSIOMA_MODE,RSIOMA_PRICE,i);
      i--;  }
   i=ii;
   while(i>=0)
      {  RSIBuffer[i]=iRSIOnArray(MABuffer1,0,RSIOMA,i);
      i--;  }
   i=ii;
   while(i>=0)
      {  marsioma[i] = iMAOnArray(RSIBuffer,0,Ma_RSIOMA,0,Ma_RSIOMA_MODE,i);
      i--;}
//----
return(0);
}
//+------------------------------------------------------------------+
Comments