RSIOMA_v3L
Download script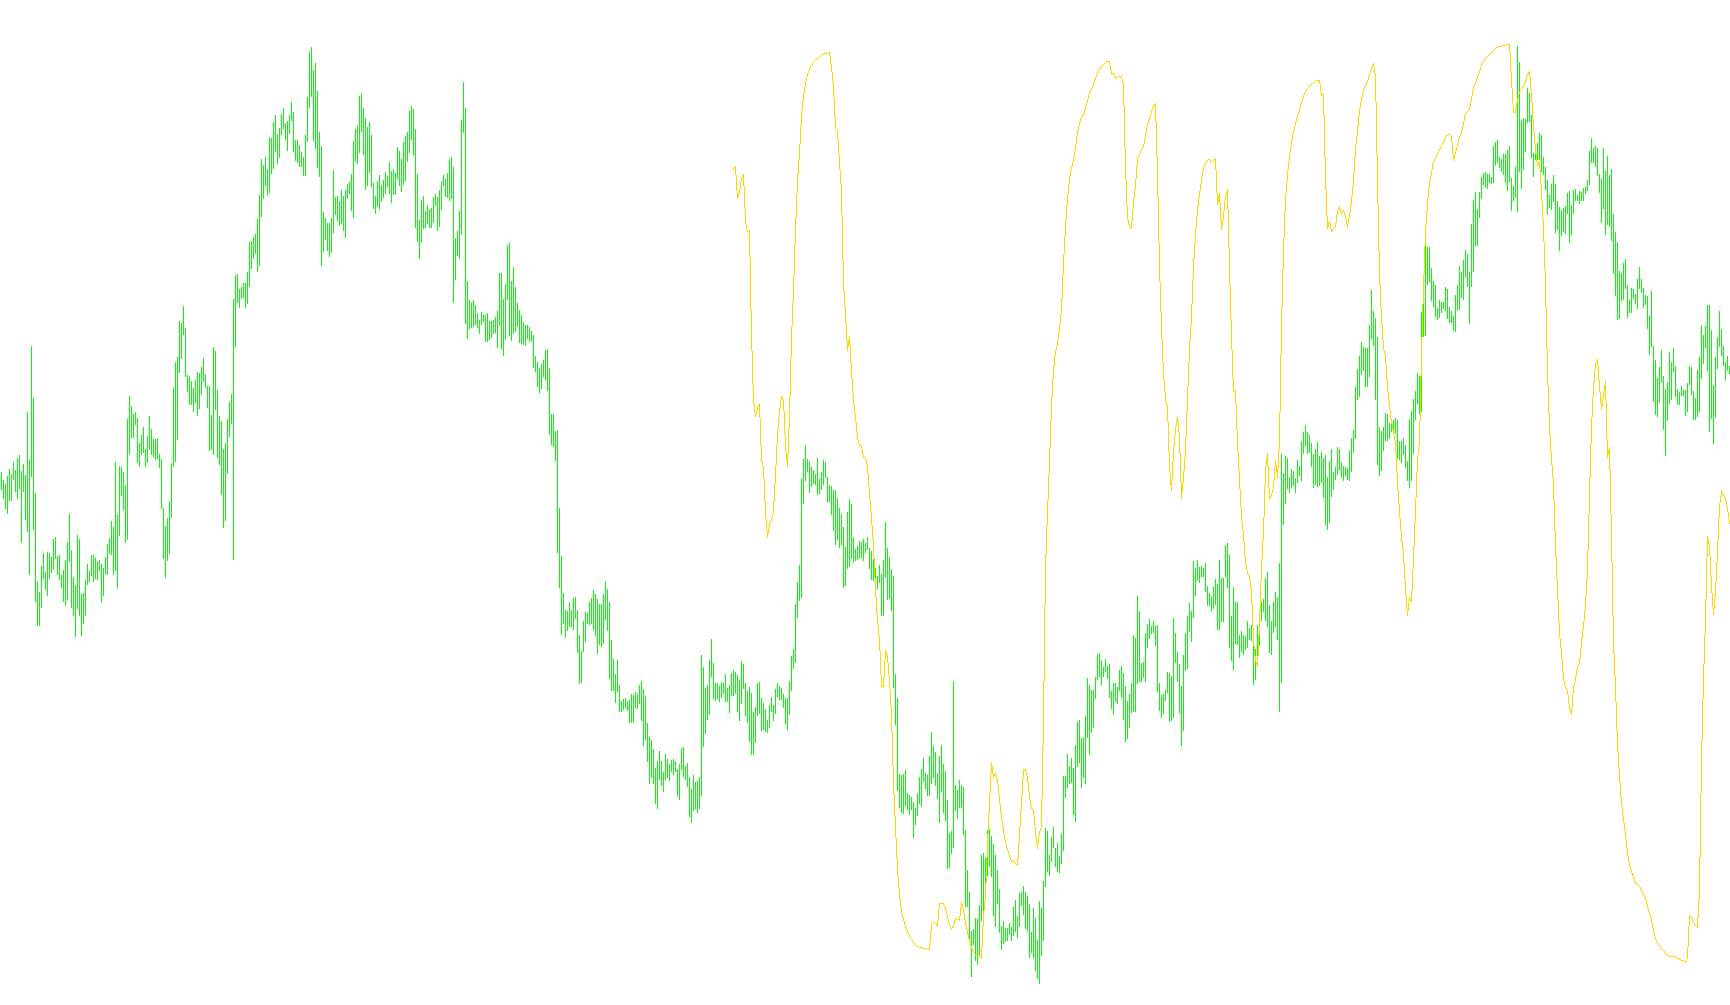
Overview of the RSIOMA Indicator
The RSIOMA is a specialized technical analysis tool designed to help traders identify market momentum and potential trend reversals. It functions by layering two fundamental financial metrics—Moving Averages and the Relative Strength Index (RSI)—into a single, cohesive visual display.
How the Logic Works
To understand how this script processes data, it is helpful to look at it as a three-step calculation "pipeline":
1. Smoothing the Price Data (The Moving Average) Instead of calculating momentum based on raw, volatile price action, the script first applies a Moving Average. This step filters out "market noise"—those small, erratic price jumps that can often trigger false signals. By using a Moving Average as the foundation, the tool focuses on the broader direction of the price movement over a specific period.
2. Measuring Momentum (The RSI Component) Once the price data has been smoothed, the script applies the Relative Strength Index (RSI) logic to that smoothed data. Traditionally, RSI measures how fast and how far an asset's price is moving. By applying it to a Moving Average rather than raw prices, the indicator produces a much "cleaner" momentum reading. It essentially tells you: "Is the current trend gaining strength or losing steam?"
3. Visual Output and Thresholds The final result is displayed in a separate window on your chart. The script automatically sets up several key horizontal levels (such as 20, 30, 50, 70, and 80). These act as "zones" for the trader:
- Overbought/Oversold Zones: When the indicator reaches extreme highs or lows, it suggests the market may be overextended.
- Trend Confirmation: The movement of the line relative to the center (50) and the outer boundaries helps traders visualize whether the current momentum is bullish (upward) or bearish (downward).
Summary for Traders
The core logic of the RSIOMA is refinement. By smoothing the price before calculating momentum, it aims to provide a more stable and reliable visual representation of market trends compared to a standard RSI. It helps traders avoid "choppy" signals by ensuring that the momentum being measured is based on established price trends rather than momentary fluctuations.
//+----------------------------------------------------------------------------------+
//|      RSIOMA_v3L    by  Mladen  &  fxbs       Kalenzo              | fxtsd.com |ik|
//|  Hornet(RSIOnArray)    2007, FxTSD.com       MetaQuotes Software Corp.           |
//|  //Hist & Levels 20/80;30/70  CrossSig       web: http://www.fxservice.eu        |
//|  //Rsioma/MaRsioma X sig ()                  email: bartlomiej.gorski@gmail.com  |
//+----------------------------------------------------------------------------------+

#property copyright "Copyright © 2007, MetaQuotes Software Corp."
#property link      "http://www.metaquotes.net/ Kalenzo|bartlomiej.gorski@gmail.com "

#property indicator_separate_window
#property indicator_buffers   1
#property indicator_minimum -20
#property indicator_maximum 110
#property indicator_color1     Blue
//
#property indicator_width1  2
//
#property indicator_level1 100
#property indicator_level2 80   //76.4
#property indicator_level3 70   //61.8
#property indicator_level4 50
#property indicator_level5 30   //38.2
#property indicator_level6 20   //23.6
#property indicator_levelcolor DarkSlateGray
//------------------------------------------

//---- input parameters

extern int    RSIOMA          = 14;
extern int    RSIOMA_MODE     = MODE_EMA;
extern int    RSIOMA_PRICE    = PRICE_CLOSE;
//

extern int    BarsToCount         = 500;

//---- buffers
//
//    "indexes"
//

double MABuffer1[];
double RSIBuffer1[];

//
//
//    indexes
//
//

double RSIBuffer[];

//
//
//

int      correction;
datetime lastBarTime;
string   short_name;


//+------------------------------------------------------------------+
//| Custom indicator initialization function                         |
//+------------------------------------------------------------------+

int init()
{
   short_name = StringConcatenate("RSIOMA[",RSIOMA,"]");
   IndicatorShortName(short_name);

   //
   //
   //

   SetIndexBuffer(0,RSIBuffer);
   //
   //
   SetIndexLabel(0,"Rsioma("+RSIOMA+")");


   //
   //
   //    additional buffer(s)
   //
   //


      correction  = RSIOMA+RSIOMA;

      BarsToCount = MathMin(Bars,MathMax(BarsToCount,300));
          ArrayResize( MABuffer1 ,BarsToCount+correction);
          ArrayResize( RSIBuffer1,BarsToCount+correction);
          ArraySetAsSeries(MABuffer1 ,true);
          ArraySetAsSeries(RSIBuffer1,true);
                 lastBarTime = EMPTY_VALUE;

      //
      //
      //

   return(0);
}


//+------------------------------------------------------------------+
//|                                                                  |
//+------------------------------------------------------------------+

int start()
{
   static bool init=false;
   int    counted_bars=IndicatorCounted();
   int    limit,i=0;

   //
   //
   //


   if(counted_bars<0) return(-1);
   if(lastBarTime != Time[0]) {
      lastBarTime  = Time[0];
                  counted_bars = 0;
      }
      if(counted_bars>0) counted_bars--;
              limit=Bars-counted_bars;
              limit=MathMin(limit,BarsToCount+correction);

   //
   //
   //

      for(i=limit;i>=0;i--)
   MABuffer1[i]  = iMA(Symbol(),0,RSIOMA,0,RSIOMA_MODE,RSIOMA_PRICE,i);
      for(i=limit;i>=0;i--)
   RSIBuffer1[i] = iRSIOnArray(MABuffer1,0,RSIOMA,i);
      for(i=limit;i>=0;i--)
       {
    RSIBuffer[i]= RSIBuffer1[i];

       }
   //
   //
   //

   for (i=0;i<indicator_buffers;i++) SetIndexDrawBegin(i,Bars-BarsToCount);
   return(0);
}


//+------------------------------------------------------------------+
Comments