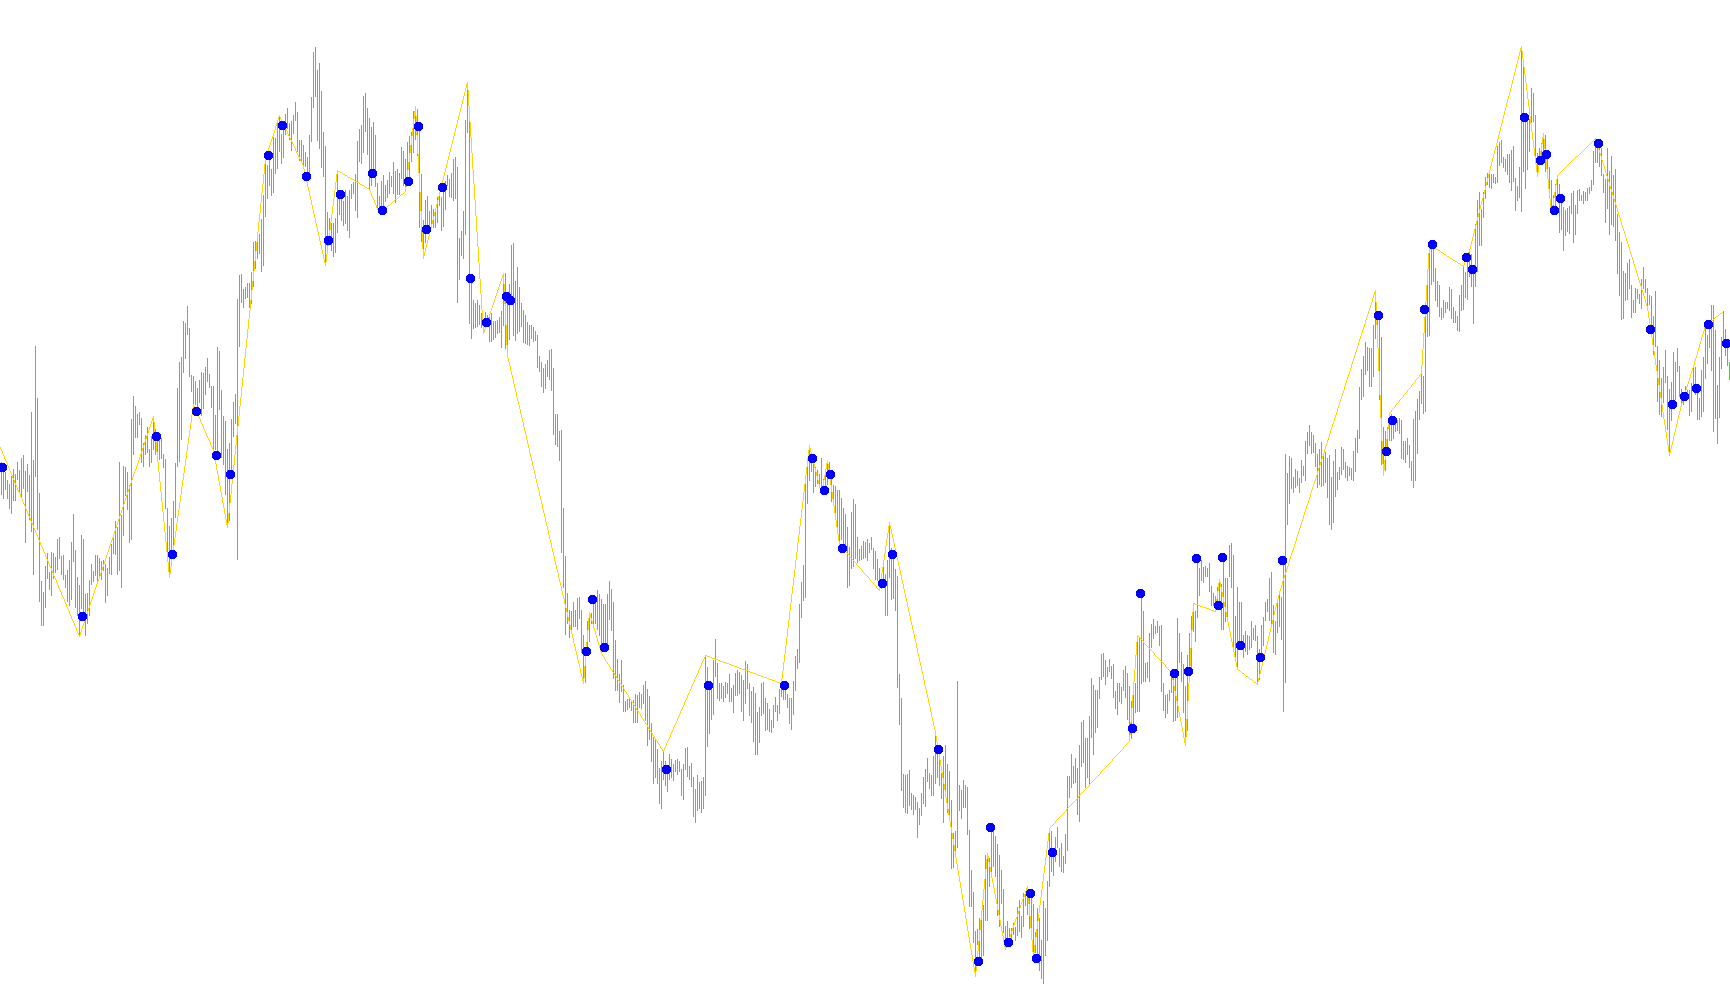
This tool is designed to analyze historical price action on a trading chart to identify specific structural patterns. By scanning through a large volume of past data—specifically the last 1,000 candles—it looks for significant shifts in market momentum by comparing current price movements against previous points in time.
How the Logic Works
The script functions by scanning the market history and looking for two distinct types of "structural turns." It evaluates the relationship between four consecutive price bars to determine if a trend has reached a pivot point:
1. Identifying Bullish Structural Turns (Upward Momentum) The tool looks for instances where the price has formed a specific "V-shape" or "bottoming" behavior. It checks if:
- The closing prices show a relative rise compared to the preceding bars.
- The lowest points (lows) of the candles are consistently higher than the lows of the previous period. When these conditions are met simultaneously, the script identifies a potential reversal point and marks it on your chart with specific visual indicators to highlight where the upward momentum began.
2. Identifying Bearish Structural Turns (Downward Momentum) Conversely, the tool scans for "inverted" behavior to find potential peaks or falling trends. It looks for instances where:
- The closing prices show a relative drop compared to the preceding bars.
- The highest points (highs) of the candles are consistently lower than the highs of the previous period. When this downward trend is confirmed by the logic, the tool places visual markers on the chart to indicate where the price reached a high point before potentially moving lower.
Visual Output
Rather than just providing raw data, the script translates these mathematical conditions into visual cues on your trading platform:
- Trend Sections: It draws lines or sections to help illustrate the flow of the market.
- Directional Markers: It places specific arrow-like icons at the exact price levels where the identified structural turns occurred, allowing you to see historical "turning points" at a glance.
In summary, this script acts as an automated historian. It filters through hundreds of bars of data to highlight the exact moments where the market's "floor" or "ceiling" shifted, helping traders visualize key structural transitions in price history.
//+------------------------------------------------------------------+
//+                                                                  +
//+------------------------------------------------------------------+
#property indicator_chart_window
#property indicator_buffers 2
#property indicator_color1 Blue
#property indicator_color2 Green

extern int DeepBars=1000;
//---- buffers
double ExtMapBuffer1[];
double ExtMapBuffer2[];
//+------------------------------------------------------------------+
//| Custom indicator initialization function                         |
//+------------------------------------------------------------------+
int init()
  {
   IndicatorShortName("Demark");
//---- indicators
//   SetIndexStyle(0,DRAW_ARROW);
   SetIndexStyle(0,DRAW_SECTION);
   SetIndexBuffer(0,ExtMapBuffer1);
   SetIndexEmptyValue(0,0.0);
   SetIndexBuffer(1,ExtMapBuffer2);
   SetIndexStyle(1,DRAW_ARROW,EMPTY,4);
   SetIndexArrow(1,159);
//   SetLevelStyle(STYLE_SOLID, 5, Green);
   SetIndexEmptyValue(0,0.0);
//----
   return(0);
  }
//+------------------------------------------------------------------+
//| Accumulation/Distribution                                        |
//+------------------------------------------------------------------+
int start()
  {
   int i;
//----
   i=DeepBars;
   for(i=1;i<=DeepBars;i++)
    {
     if (((iClose(Symbol(),0,i)>iClose(Symbol(),0,i+1)) && (iClose(Symbol(),0,i+2)>iClose(Symbol(),0,i+1)) && (iClose(Symbol(),0,i+3)>iClose(Symbol(),0,i+2))) &&
        ((iLow(Symbol(),0,i)>iLow(Symbol(),0,i+1)) && (iLow(Symbol(),0,i+2)>iLow(Symbol(),0,i+1)) && (iLow(Symbol(),0,i+3)>iLow(Symbol(),0,i+2))))
      {
       ExtMapBuffer2[i-1]=iLow(Symbol(),0,i-1)-5*Point;
       ExtMapBuffer1[i+1]=iLow(Symbol(),0,i+1);
      }
      if (((iClose(Symbol(),0,i)<iClose(Symbol(),0,i+1)) && (iClose(Symbol(),0,i+2)<iClose(Symbol(),0,i+1)) && (iClose(Symbol(),0,i+3)<iClose(Symbol(),0,i+2))) &&
        ((iHigh(Symbol(),0,i)<iHigh(Symbol(),0,i+1)) && (iHigh(Symbol(),0,i+2)<iHigh(Symbol(),0,i+1)) && (iHigh(Symbol(),0,i+3)<iHigh(Symbol(),0,i+2))))
      {
       ExtMapBuffer2[i-1]=iHigh(Symbol(),0,i-1)+5*Point;
       ExtMapBuffer1[i+1]=iHigh(Symbol(),0,i+1);
      }
    }
//----
   return(0);
  }
//+------------------------------------------------------------------+
Comments